Quantcast
Channel: François de Siebenthal
Viewing all 2306 articles
Browse latest View live

Invitation; initiative sur les soins infirmiers.

$
0
0


Chers collègues,

Ça y est – nous avons atteint les 120’000 signatures début octobre. Et ce fut remarquablement rapide,

puisque nous sommes à 10 mois du délai imparti.
Dans toute la Suisse, de très nombreuses personnes ont apporté leur contribution en participant à la

récolte de signatures et se sont engagées en récoltant également auprès de leur entourage personnel.

Nous vous remercions chaleureusement pour votre engagement, ainsi que toutes les personnes et

organisations qui soutiennent l’initiative sur les soins infirmiers.


Nous nous réjouissons maintenant d’organiser la prochaine étape: le dépôt des signatures à la

Chancellerie fédérale


le mardi 7 novembre 2017 à 14 heures sur la Place fédérale


Venez nous rejoindre à Berne ! Nous remettrons les signatures tous ensemble ! Le résultat

extrêmement rapide de la récolte est un signal clair aux politiques, et celui-ci sera d’autant plus fort si

de très nombreuses personnes se retrouvent sur la Place fédérale. Venez si possible en tenue de travail

et décorez vos vêtements avec de nombreux badges…

Inscription: Je/nous participons à cet événement historique et serons présents sur la Place fédérale le 7

novembre.
Merci d’envoyer d’ici le 27 octobre 2017 un mail avec les indications suivantes:
Nom et adresse mail, 7.11.17, initiative sur les soins infirmiers.
Envoyer à denise.biedermann@sbk-asi.ch


Rendez-vous à Berne!


Avec mes cordiales salutations


Helena Zaugg Sophie Ley Yvonne Ribi

Présidente Vice-présidente Secrétaire générale


  • Comité de soutien

  • Ensemble, nous réussirons!

    Les 120'000 signatures nécessaires ont été réunies en l’espace de 8 mois.
    La première étape est donc achevée.

    Mais l’initiative sur les soins infirmiers a besoin de votre soutien à l’avenir aussi.

    Commandez ici le matériel publicitaire pour l‘initiative: des affiches, des badges, des argumentaires.


Association suisse des infirmières et infirmiers ASI

Choisystrasse 1, 3008 Berne, Tél: 031 388 36 36, Fax: 031 388 36 35

info@sbk-asi.ch - http://www.sbk-asi.ch

Invitation Ve.17.11, Valpré,

$
0
0


Il est urgent de prendre le temps. Se libérer de l'immédiateté

Découvrez le programme complet

Vendredi 17 novembre, au centre de Valpré, à Lyon


7h30- 8h : Accueil- café

8h-9h : La Matinale des Entretiens de Valpré, co-organisée avec les Entrepreneurs et Dirigeants Chrétiens (EDC)
Ralentir pour réussir
David BERNARD, conférencier à Montréal
Animation : Armelle DEBUCHY et Frédéric NEYMON (membres EDC)

9h15-10h15: Table ronde en partenariat avec Siparex
A quel temps conjuguer l’économie ? 
Jean-Paul BAILLY, ancien président de la RATP et de La Poste
Jean-Hugues de LAMAZE, associé du fonds d’investissement Ecofin
Valérie POINSOT, directrice générale déléguée de Boiron
Animation : Pierre-Henri de MENTHON (Challenges)

10h30 - 11h30: Table ronde en partenariat avec l’Université catholique de Lyon (UCLY) et La Croix
"Le temps est supérieur à l'espace"
Echanges avec des enseignants chercheurs de l’université catholique de Lyon, autour de ce principe d'action formulé par le pape François
Remise du prix des Entretiens de Valpré, récompensant des travaux universitaires sur l'enseignement social et économique des Églises.
Animation :  père Dominique GREINER A.A (La Croix)

12 h-12 h 45: Masterclass
Cardinal Philippe BARBARIN, archevêque de Lyon
"Il y a un temps pour chaque chose"

12h45-14 h : Déjeuner et Masterclass
Etienne KLEIN, directeur de recherche au Commissariat à l'Energie Atomique
Quel sens le temps donne-t-il au progrès ?
 
14h15-15h15: Concert en partenariat avec la Banque Rhône Alpes
Le temps, oxygène de la musique
Olivier CANGELOSI, pianiste

15h30-16h30: Table ronde en partenariat avec la Fondation Saint Irénée
Le temps, ce n’est pas de l’argent !
Jean-Marc COURAU, président de Paralu, administrateur de la fondation Saint-Irénée
Christian BARQUI, président de l’Association pour le Progrès du Management (APM)
Guillaume DECITRE, président du groupe Decitre
Frédéric LAVENIR, directeur général de CNP Assurances, président de l’ADIE
Animation : Christian de CAQUERAY (journaliste)
 

17h-18h15 : Ateliers

Réflexion pratique par petits groupes (20 personnes maximum) autour de deux experts du sujet traité.

1.Temps de travail, comment trouver l’organisation idéale ?
2. "Digital-détox"… quand il faut prendre le temps de se déconnecter !
3. Le développement personnel, un temps bien investi pour l’entreprise ?
4. Alors le temps, c'est toujours de l'argent ?
5. Emprunter les Chemins de l'Eglise, prendre le temps de se retrouver…
6. Le temps de l’école doit-il se libérer de toute immédiateté ?
7. Organiser la gestion de crise en entreprise : il est urgent d’en prendre le temps !
8. Le temps de la vie, un temps biologique et éthique…
9. "Ô temps suspends ton vol" dans les jardins de Valpré…
10. « Tout s’accélère ». Prendre le temps d’une séance de ciné-débat
11. Prier au quotidien: temps perdu pour le dirigeant ?
12. Dirigeants, quel juste rythme pour la transformation de l’entreprise ?

18h45-19h45 : Table ronde en partenariat avec Kéa
Homo numéricus, l’homme accéléré ?
Jerick DEVELLE, directeur marketing d’Adecco
Laurent FIARD, co-Président Visiativ, Président Medef Lyon-Rhône
Juliette JARRY, vice-Présidente de la région Auvergne Rhône-Alpes, en charge du numérique
Hervé PILLAUD, agriculteur, auteur conférencier
Animation : Vincent de FELIGONDE (La Croix)

20h-21h : Débat
Et l’homme pendant ce temps-là?
François-Daniel MIGEON, fondateur du Thomas More Leadership Institute
Christian STREIFF, ancien président de PSA
Pierre de VILLIERS, ancien chef d’état-major des Armées
Animation : Philippe LANSAC (RCF)

21h : cocktail ponctué par la remise d’un prix de la Fondation Saint-Irénéé

Samedi 18 novembre, au centre de Valpré, à Lyon

De 8h à 13h, temps de retraite spirituelle sur le thème du silence pour se libérer de l’immédiateté. Préparé par le père Arnaud ALIBERT A.A, Véronique BOUSCAYROL, présidente de Valpré et Bernard LAURENT, professeur d’économie à l’EM Lyon, conclu par une messe et suivi d’un déjeuner.

S'inscrire en ligne

Retenez la date de la 16e édition 17 novembre 2017 à Valpré, Lyon


François de Siebenthal: La Banque de Temps Let's Act est en ligne.

desiebenthal.blogspot.com/2017/01/la-banque-de-temps-lets-act-est-en-ligne.html

13 janv. 2017 - Nous avons le plaisir de vous informer que la Banque de Temps Let's Act ... François deSiebenthal: Systèmes d'échanges locaux améliorés.

Droit au temps libéré Samuel Michalon - Baptiste Mylondo - Lilian ...

https://plus.google.com/117421548238726599207/posts/2fG5Bygc2Md

18 oct. 2013 - Samuel Michalon - Baptiste Mylondo - Lilian Robin Non au temps plein subi ! Plaidoyer pour un droit au temps libéré Il faut adapter le travail à l'homme et non plus ...

Banques du temps ? S eriez-vous prêt à payer directement en temps ...

https://plus.google.com/117421548238726599207/posts/6FuDqrsxfNq

26 janv. 2016 - Mais ce que l'on dépense vraiment, c'est notre temps de vie. Parce que lorsque j'achète quelque chose ou q... François de Siebenthal: Banques du temps ?

Stop aux machines de votes électroniques.

$
0
0
USA, Virginie: stop aux machines de votes électroniques. 

D' autres États US réévaluent le piratage des machines, et veulent revenir aux bulletins de vote en papier. Heureusement, les jours des machines de vote électronique piratables trop facilement pourraient bientôt être finis. Depuis plus d' une décennie, l' AFP notamment a fait des reportages sur la façon dont il est facile de pirater les systèmes de vote informatisés qui se sont propagées dans tout le pays.

On a documenté des accusations de vols de votes, des dysfonctionnements fréquents, et l' absence de traces écrites vérifiables et des programmes falsifiables... 
En Virginie, les responsables électoraux ont peur que les machines de vote électronique bouleversent le processus démocratique. 

Le 8 septembre, avec une couverture médiatique largement limitée aux points de vente locaux et régionaux, « Le ministère de la Virginie des élections ont appelé à la dé-certification immédiate du matériel de vote [électronique] en Virginie, et le Conseil des élections d' Etat a approuvé la demande en vue d'augmenter la sécurité et l' intégrité des systèmes de vote de Virginia avant l'élection Novembre [2017], » Andrea Gaines, 
fonctionnaire électoral de l' État , l' a annoncé dans un communiqué de presse. 

La décision de la Virginie à dé-certifier les machines de vote électronique entre en vigueur immédiatement et « signifie que [machines de vote électronique] ne peuvent plus être utilisées pour les élections en Virginie », a souligné Mme Gaines.

Catalogne: les dettes odieuses !

$
0
0

Catalogne, dettes odieuses à 106 % ( ou plus, l'ardoise monterait à 134% de son PIB, selon le Temps... voir ci-dessous ) de son PIB ? 

La commission européenne fait pression sur la Catalogne !

Menaces des banques !

Ce qui bloque, l'audit sur les dettes !

N'importe quoi, voir ci-dessous !

En cas d'indépendance, la Catalogne prend un risque économique ...

https://www.letemps.ch/.../cas-dindependance-catalogne-prend-un-risque-economique

29 sept. 2017 - Dynamique, équilibrée et ouverte, l'économie catalane pèse 221 ... de 20% de la dette nationale, l'ardoise monterait à 134% de son PIB.

La Catalogne sous asphyxie financière - Le Temps

https://www.letemps.ch/monde/2017/09/18/catalogne-asphyxie-financiere

18 sept. 2017 - Le gouvernement espagnol a décidé de retirer à la Catalogne le contrôle de ses ... de l'économie espagnole (19% du PIB national), la Catalogne connaît ... Avec une dette totale de 51 milliards d'euros contractée avec l'Etat ...

La Catalogne peut-elle devenir autonome sur le plan économique?

www.lefigaro.fr › Économie › Conjoncture

30 sept. 2017 - Surtout, la Catalogne porte un lourd handicap. Sa dette publique, égale à 36% du PIB catalan, est l'une des plus élevées du pays. Et nul doute ...

Collectif pour un audit citoyen de la dette | Page 2

https://www.audit-citoyen.org/author/admin/page/2/

Le Collectif pour un audit citoyen de la dette publique et le « Collectif avec les ... à la Grèce : la dette publique qui représentait 113 % du PIB en 2008 a bondi à 180 ... de la dette publique grecque est illégale, illégitime, odieuse ou insoutenable. ..... 105. Lieben Gilbert, Secrétaire Générale CGSP Wallonne, Belgium 106.

Le nouveau gouvernement espagnol doit mener un audit de la dette ...

https://entreleslignesentrelesmots.wordpress.com/.../le-nouveau-gouvernement-espagn...

25 juin 2016 - La partie publique représentait 12 % du total de la dette, alors que la dette ... soit 122 %du PIB, mais la dette totale de l'économie espagnole est toujours de 3 .... doit donc considérée commeodieuse, au même titre que la dette accumulée .... 106. Miquel Carrillo Ponce, Enginyer i consultor en cooperació.

[PDF]le vrai visage de - L'Amer Dessous Des Cartes

https://explicithistoire.files.wordpress.com/.../ratier-emmanuel-le-vrai-visage-de-manu...

plus haute bourgeoisie catalane par son père et d'une famille suisse ...... gramme: faire passer le déficit du PIB sous les 3% dès 2013, la TVA so- ..... la dette de la commune a augmenté de 276 %. ...... 106. LE VRAI VISAGE DE MANUEL VALLS général de la Fondation Jean Jaurès, membre du Siècle, ancien conseiller.

Catalogne & la Suisse

$
0
0


Les banques volent les richesses régionales par leurs tricheries comptables et politiques.

Par notamment leurs politiques de titrisations, elles accaparent les valeurs réelles avec le néant bancaire ( ex nihilo ).

Exemple suisse:

La politique suisse mise en échec ! La Suisse continue d'être bradée à vil prix. L'oligarchie financière internationale lance une nouvelle offensive pour capter graduellement le secteur énergétique de la Suisse : trois secteurs clefs du groupe Alpiq sont à vendre.
Si la politique suisse déplace désormais sur l'échiquier sa dame blanche (Alpiq et Axpo, suivis de BKW et le reste du secteur énergétique) sur la case «piège de la dette néoliberale», alors la Suisse se retrouvera échec et mat.
L'oligarchie financière semble perdre patience. À travers Goldman Sachs, elle mène désormais ouvertement sa dame noire à l'offensive dans la phase décisive de la partie. De plus elle utilise ses banques Union Bank of Singapore (UBS) et Credit Qatar (CS) comme tours noires, lesquelles attribuent à Alpiq la note BBB juste au dessus de la notation crédit pourri.
Comment ça ? Les entreprises multinationales détiennent la majorité des actions nominatives AYANT DROIT DE VOTE des deux banques - dans le cas de la CS ouvertement et dans le cas de l'UBS de manière occulte. Si cette vérité vous a échappé, la cause pourrait se trouver dans la réforme douteuse du droit des sociétés anonymes : les actions «dispo» et le modèle «nominee» permettent à des grands investisseurs étrangers de reprendre des sociétés anonymes suisses dans la plus grande discrétion. De longue date CS et UBS sont devenues des banques étrangères, qui continuent sans scrupule à se présenter comme des banques suisses (plus ample information dans un post ultérieur).
La politique suisse fait face à des décisions importantes. L'alternative est la suivante :
1) ALTERNATIVE « ÉCHEC ET MAT »
Selon cette variante la politique suisse continue de tolérer que l'empire mondial des 147 entreprises financières [1-3] prenne insidieusement le contrôle dans les principales entreprises de notre secteur énergétique.
Les intermédiaires de l'oligarchie financière scindent Alpiq et Axpo en plusieurs unités : des secteurs clefs fortement sous-évalués et les gains futurs sont liés dans des prétendues «unités de solution». En coulisse l'oligarchie reprend ces «unités de solution» à vil prix.
En revanche dans les «unités de problème» on retrouvera les centrales nucléaires vétustes, une montagne de déchets nucléaires accumulés pendant plus de 50 ans, le problème de stockage non-résolu ainsi que les dettes et coûts par milliards. Comme appât on ajoute nos barrages bien-aimés.
Par attachement au barrages, les communes et cantons, s'ils acceptent l'appât, se retrouveront avec les «unités de problème» sur le dos. Les communes et cantons, en perdant des rentrées financières et en subissant des coûts supplémentaires par milliards, perdront leur capacité financière et par là leur autonomie.
Maintenant le piège se referme : les «créanciers» internationaux dicteront aux communes et cantons surendettés leurs conditions très désavantageuses pour la reprise du reste de notre infrastructure critique, à travers des «programmes de rééchelonnement de la dette». Le château d'eau de l'Europe avec ses barrages et sa force hydraulique passera dans les mains de l'oligarchie financière internationale, selon le modèle de la Grèce.
Les professionnels des entreprises sont prétendument supérieurs aux politiciens et experts de notre système de milice. Dans la réalité le président du conseil d'administration Jens Alder et la PDG Jasmin Staiblin ont mené Alpiq au bord de la faillite. L'argument mille fois répété d'un «marché difficile» est une pauvre excuse. Une fois de plus la performance catastrophique de ces «professionnels» correspond au niveau lamentable de la «solution» qu'ils proposent : Goldman Sachs pourrait-il résoudre la crise dans «l'intérêt» de la Suisse ? Un loup rentrerait-il dans la bergerie ?
Goldman Sachs culmine dans le top 20 des 147 sociétés qui dominent le monde [1-3] et compte traditionnellement des collaborateurs dans l'administration américaine. Goldman Sachs est donc tout en un une banque d'investissement offshore, le gouvernement américain et l'oligarchie financière. Actuellement Goldman Sachs relance l'industrie nucléaire, du charbon et du pétrole et sonne le glas de la transition énergétique des États-Unis.
Et maintenant ce gouvernement Sachs devrait céder à l'oligarchie pour une bouchée de pain des secteurs d'Alpiq indispensables pour notre transition énergétique - prétendument pour sauver la compagnie et pour mener cette transition énergétique au succès. Sérieusement ?
Avec son expertise du 14 juillet 2017 [4], le professeur de droit saint gallois Peter Hettich a clairement démontré à la politique suisse COMMENT l'oligarchie privatise le domaine publique et pourquoi les politicien(ne)s sont ramené(e)s au rôle des spectateurs.
Les politiciens gèrent le bien commun; les entreprises et leurs propriétaires gèrent les biens privés. Si on se fie aux «professionnels» d'Alpiq, Goldman Sachs devrait transférer le bien commun à vil prix en mains privées. Ainsi notre État devient graduellement une entreprise multinationale ! Or les entreprises ne sont pas des démocraties, mais des autocraties. Dans une nation dépourvue de biens communs les politiciens, n'ayant plus rien à gérer, sont remplacés par des propriétaires privés (les nouveaux seigneurs).
En autres mots : cette politique n'engendre pas seulement sa propre fin, mais elle abroge aussi la démocratie, la liberté et la prospérité de notre pays. Est-ce cela que nous voulons ?
2) ALTERNATIVE « REBOUND ET CONTRE »
L'équipe suisse peut reprendre l'initiative (le ballon) de l'adversaire à travers d'un Rebound. Un Contre lui permet d'utiliser l'énergie de l'équipe opposée pour une contre-offensive surprenante.
La capacité financière et les ressources de l'oligarchie internationale (et chinoise) dépassent de loin celle de la Suisse. Pour mémoire, avec ses 8 millions d'habitants, notre pays a environ la taille de la ville de Quanzhou - vingtième sur la liste des plus grandes villes chinoises.
La Suisse ne peut tenir tête à un tel adversaire que si les communes et cantons collaborent tous partis confondus. Ne comptez pas sur la Berne fédérale où l'influence subtile de l'oligarchie est déjà trop importante. La partie actuelle va se décider aux niveau des cantons, villes et communes.
Des méga-fusions qui génèrent des mastodontes comme UBS, CS, Alpiq, Axpo etc. ont été mises en oeuvre pour que des investisseurs internationaux puissent les reprendre à terme.
La complexité artificiellement crée, la concentration du pouvoir, le secret d'entreprise et par conséquence le défaut de transparence qui rend la propagande des entreprises invérifiable, ont convaincus nos politicien(ne)s de renoncer à scinder ces mastodontes.
Jusque à présent le contribuable suisse a dû payer plus de 40 milliards de francs pour le «sauvetage» de l'Union Bank of Singapore (UBS) qui, selon l'ancien PDG Oswald Grübel, était inutile. [5]
Prendrons notre courage à deux mains ! DANS TOUS LES CAS Alpiq et Axpo vont être scindées - que ce soit par les intermédiaires de l'oligarchie financière dans leurs intérêts privés - ou par la politique suisse dans l'intérêt des communes et cantons.
La bonne décision tombe sous le sens. En vue du danger des faillites imminentes il est recommandable de scinder au plus vite Alpiq et Axpo en unités utiles qui seront distribuées aux entreprises d'énergie des communes et cantons. La BKW peut encore attendre. Actuellement la plus haute priorité est de conserver des participations publiques majoritaires.
Nos entreprises d'énergie des communes et cantons, qui agissent avec succès à l'intérieur du pays et à l'étranger, peuvent rapidement mener les unités ainsi reparties au seuil de rentabilité. De la sorte les communes et cantons recevrons enfin les revenus dont ils ont grand besoin. Ceci va leur permettre d'investir dans les énergies renouvelables. Les effets pervers du «marché» de l'énergie néoliberalisé seront immédiatement neutralisés. Cette stratégie est en accord avec la tendance de décentralisation mondiale dans le secteur de l'énergie et ainsi assure le succès de notre transition énergétique.
Le temps presse. Allons-y !
[1] Ces 147 sociétés qui dominent le monde - Courrier international 2011-12-01
http://www.courrierinternational.com/…/ces-147-societes-qui…
[2] Financial world dominated by a few deep pockets - Science News 2011-09-24
https://www.sciencenews.org/…/financial-world-dominated-few…
[3] The Network of Global Corporate Control - Glattfelder & Co PLOS ETHZ 2011
http://journals.plos.org/plosone/article…
[4] Une scission de BKW SA enfreindrait la garantie de la propriété et la liberté économique - Canton de Berne 2017-08-28
http://www.be.ch/…/20170825_1607_aufspaltung_der_bkwagwuerd…
[5] Ex UBS CEO Grübel rechnet ab - Die UBS-Rettung war unnötig - Blick 2012-10-28
http://www.blick.ch/…/wir…/gruebel-rechnet-ab-id2072767.html

Crédit Provincial - Première partie

Écrit par Louis Even le mercredi, 23 janvier 1963. Publié dans Economie

UN CRÉDIT FINANCIER PROVINCIAL POUR METTRE EN ŒUVRE LE CRÉDIT RÉEL PROVINCIAL

Louis Even

 Le réel - Le financier - La Constitution - Nos politiciens - Les "On-to-Ottawa" - Douglas

 Enregistrer


Commissions scolaires et municipalités

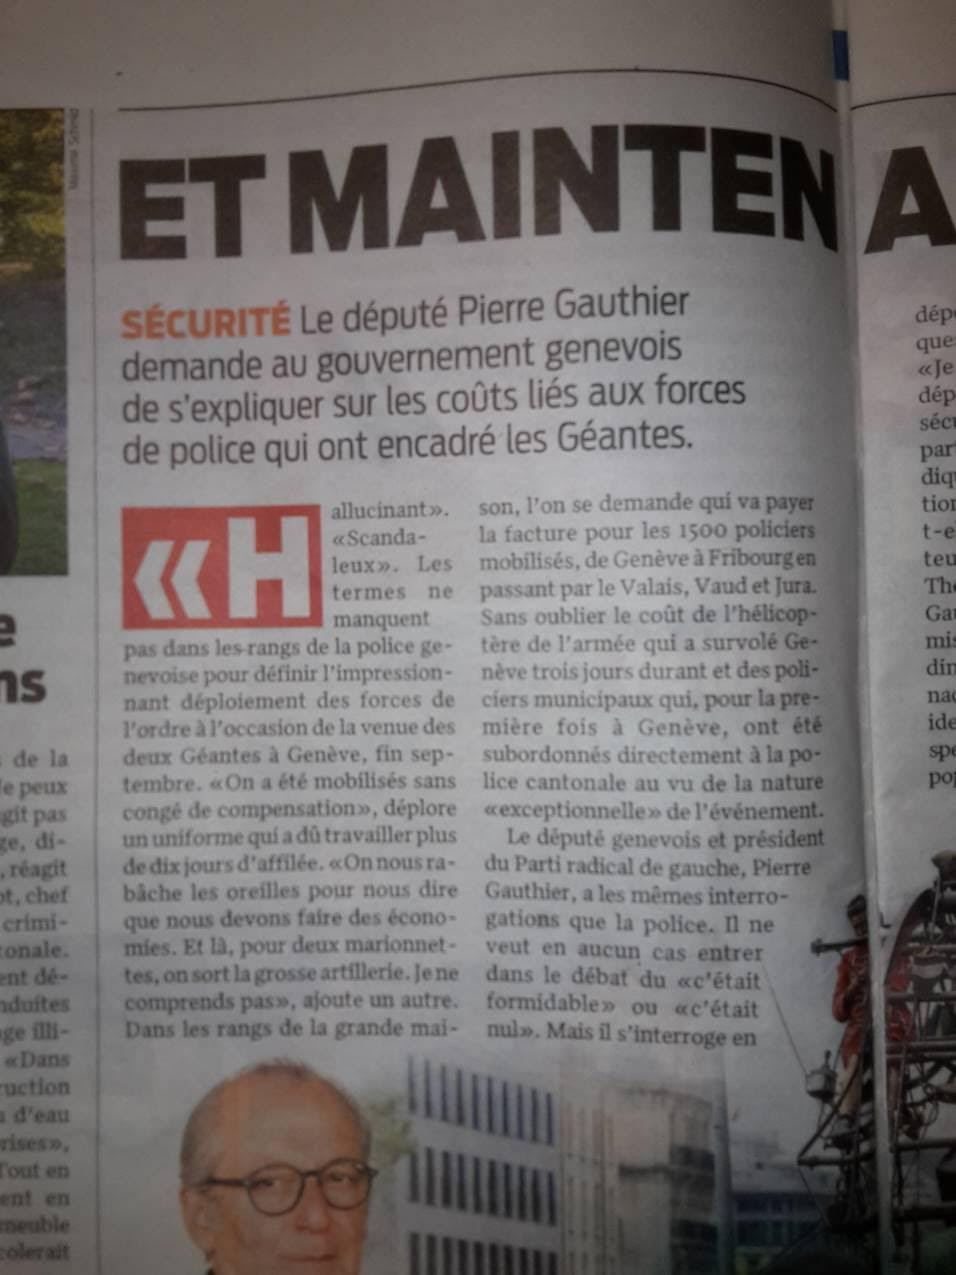
A Alma (Lac St-Jean), 7,000 écoliers ont eu des vacances inusitées en février, parce que leurs 260 instituteurs et institutrices ont déclaré un arrêt de travail (on a dit "une grève").
La raison : ces enseignants n'avaient eu aucune paye depuis huit semaines. Vivre sur ses épargnes pendant huit semaines, c'est pour plusieurs vivre en s'endettant chez le marchand. Et le marchand lui-même ne peut pas indéfiniment faire crédit à des clients : il a des obligations, lui aussi.
Mais pourquoi la Commission d'Alma ne payait-elle pas ses professeurs ? — Simplement parce que sa caisse était vide. Elle avait un déficit de $500,000, qui allait devenir un déficit de $750,000 cette année.
La banque ne voulait plus faire d'avance à une commission en telle situation.
La commission scolaire d'Alma se tournait vers Québec. A Québec, on répondait : Vous avez déjà eu toutes les subventions auxquelles vous aviez droit, aux termes de nos règlements; trouvez plus d'argent chez vos contribuables; augmentez le taux de la taxe scolaire.
La commission scolaire a fini par céder. Sans demander aux propriétaires si ça leur faisait bien plaisir, elle a porté la taxe scolaire à $1.35 dans le 100 dollars d'évaluation.
Tout de suite, démarches du gouvernement auprès de la banque pour que le crédit soit restauré (le gouvernement devenant caution). Avec une avance de la banque, chèques aux professeurs. Fin des "vacances de grève"; retour à l'école le vendredi, 22 février.
Le cas d'une caisse vide en face d'obligations pressantes n'est pas l'exclusivité de la commission scolaire d'Alma. La plupart des commissions scolaires, et des municipalités aussi, tirent la langue. D'autres corps publics également. Ét les familles aussi, même si et-h, n'attirent pas autant l'attention que les corps publics, tout en souffrant plus qu'eux, dans leur chair même.
Le gouvernement provincial est au courant de la situation désespérée des commissions et des conseils municipaux. En 1960, le gouvernement Lesage nomma un comité interministériel pour étudier le problème — et le problème est toujours là. Le Comité est maintenant remplacé par une "Commission d'enquête sur la fiscalité" ! Pour faire quoi ? Pour tâcher de découvrir des moyens plus efficaces, si possible, de financer les gouvernements en dévalisant les individus.

Le possible — L'obstacle

Mais de quel problème au juste est-il question ? Et pourquoi ce problème existe-t-il ?
Revenons au cas d'Alma. Dès que la Commission se soumet au gouvernement en acceptant de hausser la taxe scolaire, la banque accepte d'avancer des fonds — un crédit — à la Commission. Et tout de suite, tout se règle. Plus de problème. Les professeurs sont payés et peuvent se procurer de quoi vivre.
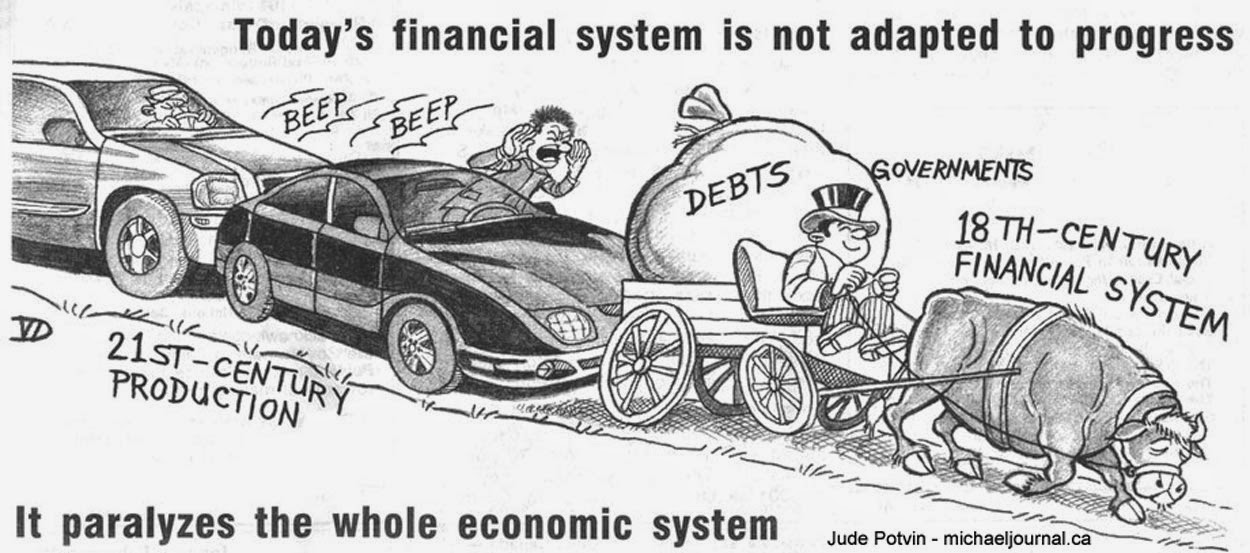
C'est donc qu'il y avait dans le pays tout ce qu'il faut pour faire vivre les professeurs. La hausse de la taxe foncière n'a pas augmenté d'une seule unité les troupeaux des cultivateurs, ni fait pousser, un fruit de plus, ni produit une verge d'étoffe de plus. Tout cela existait bel et bien et n'attendait qu'un "crédit"— des chiffres inscrits du bon côté dans les livres de la banque, pour passer les produits des fermes, ou des entrepôts, ou des étagères du marchand, dans les maisons des professeurs.
Le problème n'était donc pas du tout un problème de possibilités réelles. C'était un problème créé artificiellement par le manque de chiffres ayant le pouvoir de faire bouger les produits et les services.
Voici bientôt un demi-siècle que l'artificiel de ce problème est étalé devant le monde —plus d'un quart de siècle dans notre pays; et, en même temps, le moyen de faire disparaître cet artificiel malsain, le moyen d'enlever l'obstacle purement financier aux belles réalisations si facilement possibles.
C'est l'enseignement du Crédit Social. Nous ne parlons pas ici du parti qui porte le nom de Crédit Social et qui peut être n'importe quelle bouillie. Nous parlons de l'enseignement de Douglas, le fondateur de l'école créditiste.
Quand l'école créditiste traite de crédit, elle fait une distinction entre ce qu'elle appelle le "crédit réel" et ce qui est le "crédit financier" ou l'argent.
Le "crédit réel", c'est la capacité de produire ce qui répond aux besoins. C'est la capacité de produire de la nourriture, des vêtements. C'est la capacité de bâtir des maisons pour les familles, des écoles pour recevoir les enfants, des églises pour assembler les fidèles, des routes des chemins de fer, pour les voyages et le transport, etc. C'est la capacité de trouver des professeurs pour instruire les écoliers. Et c'est la capacité de produire les choses que les professeurs consomment, mais qu'ils ne produisent pas eux-mêmes.
Il s'agit bien là de réalités. De réalités dont l'existence ne fait pas de doute. Des réalités qui font qu'on préfère le Canada à un désert, qui font qu'on a confiance de pouvoir vivre convenablement au Canada. Cette base de confiance existait déjà quand les premiers colons vinrent de France. Ils ne seraient pas venus sans cela. Et cette base de confiance, cette capacité de produire ce qu'il faut pour les besoins, ce "crédit réel" est immensément plus grand aujourd'hui.
Par contre, il y a le "crédit financier", qui sert d'argent. Qui consiste essentiellement en chiffres légalisés. Qui peut être des chiffres gravés sur des pièces d'or (on n'en voit plus), des pièces d'argent, ou de cuivre, ou de bronze, ou de nickel, ou quoi encore. Ou des chiffres simplement imprimés, accompagnés de figurines et de quelques phrases, sur des rectangles de papier. Ou simplement, et pour la plus grande par tie, des chiffres inscrits par les banquiers dans leurs livres, quand ils font des prêts à des-emprunteurs, emprunteurs privés ou corps publics.
Ces chiffres, le "crédit financier", ne sont pas des réalités. C'est simplement l'évaluation, en chiffres, de réalités qui existent déjà; ou de production facile à réaliser quand ces chiffres viennent à point pour tirer sur la capacité de production du pays.
Dans le cas d'Alma, comme dans la multitude d'autres cas semblables, le "crédit réel" n'a jamais fait défaut une minute. Mais ce qui faisait défaut, c'était l'artificiel, les chiffres pour exprimer le "crédit réel" et pour mettre en oeuvre la capacité de produire, la capacité d'enseigner et la capacité de faire vivre les enseignants.
Mais, n'est-ce pas une situation lamentable, que celle qui permet aux contrôleurs du crédit -financier de mettre ainsi une entrave à la fonction du réel, à la-production de -biens -(produits ou services) qui répondent aux besoins de la population — enfants et adultes ?

Le crédit provincial

La capacité de production du Canada est le crédit réel du Canada. Et la capacité de production d'une province est le crédit réel de cette province.
Une province, n'importe quelle province du Canada, est capable de produire des choses pour les besoins de sa population, même si toutes les autres provinces cessaient d'exister. Nos ancêtres le faisaient déjà, avec des moyens beaucoup plus limités, sur les rives du Saint-Laurent, bien avant que le reste du Canada fût même entamé par la hache et la charrue.
Il y a donc telle chose qu'un crédit provincial : Crédit Québec, Crédit Ontario, Crédit Nouveau-Brunswick, Crédit Manitoba, Crédit Alberta, etc.
Et s'il y a un crédit provincial, il doit bien être possible de l'évaluer provincialement, puisqu'il y a dans chaque province un gouvernement pour voir à l'ordre, à l'étendue de la province. Il doit bien être possible de représenter ce crédit réel en chiffres financiers; en chiffres aptes à mettre en œuvre le crédit réel, aptes à mobiliser les ressources matérielles et les compétences humaines de la province, pour répondre aux besoins de sa population.
Le crédit financier, en effet, ne sert pas seulement d'évaluateur; il sert aussi de moyens de paiements, pour récompenser ceux qui mettent en œuvre la capacité de produire; de moyens de paiement permettant à ceux qui les reçoivent d'obtenir les produits ou services offerts à la population.
Un crédit réel provincial; du crédit financier provincial correspondant; des moyens financiers surgissant du crédit réel provincial, capables de véhiculer par toute la province les produits et services émanant de la production de la province ou reçus d'ailleurs en échange de surplus provinciaux ... voilà qui fait dresser bien des oreilles; voilà qui fait des bouches d'ahuris crier le grand mot "Constitution".

Constitution et crédit

Eh bien, venons-y à cette "Constitution". Constitution dont on parle de plus en plus avec de moins en moins de respect. Constitution, ou du moins ce qu'on appelle de ce nom au Canada, qui n'est après tout qu'une simple loi du parlement de Londres, qu'on n'a même pas pris la peine de soumettre à l'approbation des provinces ou territoires coloniaux auxquels on l'a imposée.
Eh bien, si vieillotte soit cette "constitution", si prostituée ait-elle été par ceux qui l'ont constamment interprétée pour tirer à eux la couverte, elle a tout de même su au moins reconnaître l'existence d'un crédit provincial.
Elle spécifie, en effet, que la province a le droit d'emprunter "sur le seul crédit" de la province. Le fédéral, lui, peut le faire sur le crédit de tout le Canada; mais la province sur le sien propre. C'est donc que la province possède un crédit à elle. Le Québec a droit sur son crédit, pas sur celui de l'Ontario; et vice versa. Et de même pour les autres provinces.
Mais, si la province possède un crédit, qui lui permet ainsi d'emprunter et de s'endetter —pourquoi, en toute logique, ne peut-elle pas prendre _moyen d'utiliser ce crédit sans avoir à s'endetter pour l'usage d'une chose qui lui appartient ?
Si j'ai un cheval à moi, il me permet d'emprunter sur sa valeur; mais qu'est-ce qui m'empêche d'utiliser moi-même mon cheval, quand tel est mon bon plaisir, sans avoir à m'endetter envers personne ?
Et n'est-il pas assez bizarre d'aller quémander des chiffres belges, français, anglais, américains, etc., pour mettre en œuvre le travail et les ressources naturelles du Québec, ou de l'Ontario, ou du Nouveau-Brunswick, etc. ? Pourquoi, par un simple jeu de chiffres, pourquoi avoir à payer à d'autres de la production faite par des bras de chez nous, à partir de matériaux de chez nous ?

Nos politiciens

M. Lesage étatise l'électricité, en disant que c'est pour que nous devenions maîtres chez nous. L'électricité, si importante soit-elle, ne touche tout de même qu'à une partie de notre vie économique — alors que le contrôle de l'argent, alors que le système financier touche à toute la vie économique, en gros et en détail, dans le général et dans le quotidien, dans le secteur public et dans le secteur privé. Or M. Lesage ne s'en inquiète pas !
D'ailleurs, pour acheter les réseaux des compagnies, M. Lesage commence par endetter la province de. 300 millions, qui exigeront bien des millions de plus avec les intérêts. Nous avions à payer le courant électrique aux compagnies : nous aurons maintenant à le payer au gouvernement, et à payer les compagnies en plus.
Par cet emprunt, fait sur le marché américain, M. Lesage endette sa province envers : First Boston Corporation; A. E. Ames & Co., Incorporated; Wood, Gundy & Co., Inc.; The Dominion Securities Corporation; Harriman Ripley & Co.; Smith, Barney & C.; McLeod, Young, Weir, Incorporated. -- Drôle de manière, vraiment, de rendre la population de l'État de Québec maîtresse chez elle !
Mais revenons au crédit financier. Et à la Constitution.
M. Johnson, le chef de l'Opposition, demande de convoquer des Etats-Généraux pour rédiger une nouvelle constitution. Avec quoi en vue ? La question de fiscalité, de taxation seulement ? Ou bien avec l'objectif de restituer au peuple ce qui lui appartient — son crédit ? Au peuple de l'État de Québec, le crédit du Québec. Comme au peuple de chaque province, le crédit de sa province.
Si l'on est contre la centralisation des pouvoirs à Ottawa, et par Ottawa au cerveau financier international, que l'on commence donc par se soustraire à l'instrument primordial de la centralisation : ce contrôle du crédit qui force à se plier à toutes les volontés des contrôleurs (privés) de l'argent et du crédit.
Même nos séparatistes, avec toutes leurs déclarations d'indépendance, ne semblent pas avoir conscience de la dépendance dans laquelle nous maintient le contrôle actuel du crédit financier. Il est bien plus urgent de se séparer de la dictature internationale de l'argent que de se séparer des autres provinces du Canada. Que devient l'indépendance, politique, quand la vie économique de tous les jours est sous la complète dépendance d'individus non élus qui, d'ailleurs, prennent leur inspiration et leurs directives de non-élus internationaux ?
Montréal-Matin du 18 février rapportait la déclaration suivante; faite à l'hôtel Queens par le chef séparatiste, Marcel Chaput "Nous croyons au crédit comme force de développement économique". — Fort bien, mais avec cette force laissée aux mains des contrôleurs de l'argent et du crédit qui dominent les gouvernements comme les populations ? Au bénéfice de qui seront les développements économiques qui endettent la population à mesure qu'elle crée de la richesse ? Quelle sorte d'indépendance cela signifierait-il ?
Et le parti qui ose se donner le nom de Crédit Social — que fait-il, que cherche-t-il pour s'affranchir de la tyrannie du système financier actuel ? Ce n'est certainement pas à ses dirigeants qu'il faut demander la décentralisation financière, le Québec maître chez lui, l'Ontario maître chez lui, le Nouveau-Brunswick maître chez etc.
Non. Le mot d'ordre du parti est devenu "On to Ottawa". Pas seulement de la part, de la section albertaine du parti, mais de Caouette lui-même et de ses suiveux.

Douglas et le "On-to-Ottawa"

Rappelons d'abord que le premier chef des créditistes albertains, Aberhart, a toujours tenu pour le contrôle du crédit provincialement. De 1937 à 1939, son gouvernement fit adopter plusieurs lois provinciales dans ce but, remplaçant par d'autres celles qui se faisaient bloquer à Ottawa ou dans les cours de justice.
En 1939, à cause de la guerre, il jugea devoir suspendre cette lutte. Il mourut pendant la guerre: Son successeur Manning, sous la pression de créditistes lui représentant que la guerre finie, il fallait reprendre la lutte, fit un essai, par un Bill of Rights, pas bien authentiquement créditiste, voté en 1946, puis déclaré ultra vires jusque par le Conseil Privé.
En 1947, Manning capitula complètement, et le "On-to-Ottawa" naquit de cette capitulation. Cela voulait dire : "Aberhart avait tort et Ottawa a raison."
Un parti qui capitule devant Ottawa capitulerait encore bien plus facilement devant des puissances qui dominent Ottawa, comme elles dominent Washington et les autres gouvernements même considérés souverains.
Mais que pensait le maître, Douglas, de ce "On-to-Ottawa" ?
Dès 1934, quand Aberhart faisait sa grande propagande pour le Crédit Social, quand les Fermiers-Unis étaient encore au pouvoir à Edmonton, la question fut posée à Douglas. Elle, le fut à l'enquête sur le crédit, que conduisait le -Comité Agricole de l'Assemblée Législative de l'Alberta.
Le gouvernement des Fermiers-Unis n'était pas opposé à la doctrine de Douglas, mais prétendait que la question ne pouvait relever que d'Ottawa. Aberhart, au contraire, soutenait que l'institution pouvait se faire provincialement.
Questionné sur ce point par MM. Ross et Gibbs, puis par M. MacLachlan, Douglas répondit d'abord aux deux premiers :
"Rendre la question toujours de plus en plus grosse; de plus en plus étendue, fait partie du grand plan des aviseurs du système financier. Ils le font, afin qu'on soit obligé de gagner un groupe toujours de plus en plus nombreux de personnes pour essayer de la régler.
"On tend ainsi à en faire une question mondiale, afin qu'il faille convoquer des conférences mondiales pour trouver des solutions. Or, tout le monde sait ce qu'il résulte des conférences mondiales.
"Il n'y a qu'une méthode efficace : Circonscrire de plus en plus le problème, le diminuer autant que possible, afin d'en arriver à une application quelque part."
Donc, au lieu d'attendre à avoir gagné à une idée tout le Canada, quand on a gagné une province, soit le territoire qui dépend de la plus petite unité de gouvernement doté d'un pouvoir législatif, commencer l'application là même, au lieu de grossir le problème.
Et à la question de MacLachlan, Douglas répondit encore plus longuement dans le même sens. Voici cette réponse :
"Dire : Il faut aller à Ottawa, revient à dire, en pratique sinon en paroles : Il faut s'adresser à Londres; vu qu'on a affaire avec la finance internationale, qu'on n'est pas capable de régler cela à Ottawa, il faut donc aller à Londres. Et à Londres, on vous dira : Fort bien, mais il faut agir de concert avec Wall Street (le New-York financier). Et là, on vous dira encore : Entendu, mais il- faut agir d'après la Banque des Règlements Internationaux (la banque. mondiale d'avant la deuxième guerre).
"Il n'y a absolument aucun point d'arrêt possible, une fois qu'on s'est laissé aller à renoncer, à son droit d'agir librement. C'est justement la stratégie des puissances, financières actuelles de faire de la question de finance une question mondiale, afin qu'aucune partie du inonde ne soit assez puissante pour la régler.
"Si vous voulez arriver à un résultat, le meilleur moyen est de commencer chez vous, en cherchant d'abord comment réussir provincialement. Si vous envisagez le problème dans cet esprit, vous pouvez le régler. Mais si vous référez le problème à Ottawa, vous ne pourrez certainement pas le régler.
"Si vous laissez volontiers une législation supérieure vous empêcher de faire ce. que vous voulez, vous ne pouvez sûrement réussir aucune réforme. En définitive, il vous faudra, oui ou non, dire : Peu importe l'Acte de l'Amérique Britannique du Nord; s'il nous nuit, nous le ferons MODIFIER; ou nous le CONTOURNERONS; mais nous réaliserons certainement ce que nous voulons."
Douglas ne mâchait pas ses paroles. Mais c'est que la réforme dont il était 'question est d'importance et il le savait. Aussi, comme pour justifier l'avis radical qu'il donnait, il souligna brièvement le mal que, selon lui, comme aussi selon nous, le système financier fait au monde par son contrôle arbitraire du sang de la vie économique des nations :
"A l'heure actuelle, pratiquement 90 pour cent des crimes, dans le monde entier, sont causés directement par le système financier.
"La poussée économique (parfaitement compréhensible) vers la guerre provient avant tout du fonctionnement du système financier actuel qui conduit infailliblement à une course aux marchés étrangers pour en obtenir du pouvoir d'achat.
"Toute la misère actuelle, tous les tracas des hommes d'affaires, les suicides dont le nombre ne cesse d'augmenter, la classe de parias issue de taudis ou d'autres lieux inhumains, tout cela provient directement du système financier actuel."
Après le tracé de ce tableau, le Major Douglas pouvait bien poser la question, à savoir s'il faut rester lié devant la "Constitution" qui prétend s'opposer à la volonté de toute une province pour s'affranchir d'un tel système :
"Peut-on réellement envisager tout cela et dire encore : Oh ! non, il ne faut pas toucher à l'Acte de l'Amérique Britannique du Nord ?
"Voilà le point de vue selon lequel vous devez envisager la situation. Autrement, vous ne faites tout simplement qu'accepter les conséquences logiques du système financier actuel.
"Il n'y a qu'une question à vous poser : Que pouvez-vous faire pour changer ce système financier ?
"S'il existe une loi écrite qui vous empêche de le changer, et si vous ne voulez pas violer la- loi. (c’est-à-dire si vous tenez à agir constitutionnellement), alors vous n'avez qu'une chose- à faire : changer la loi. Cela, à mon avis, ne peut se réaliser qu'au moyen d'une pression concertée de toute la population.
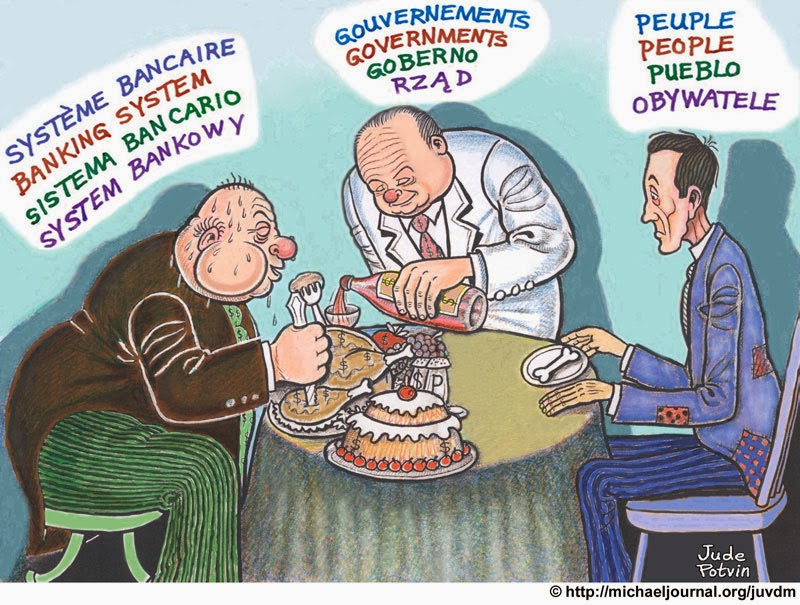
"Tout: le monde, sauf le financier, subit l'affreux fléau de ce système financier détraqué et destructeur. Je dis cela sans parti: pris. Je ne suis nullement une victime sérieuse, moi-même. Mais j'observe simplement la chose du point de vue d'un ingénieur."
Voilà comment parlait Douglas, le maître, le découvreur et l'énonciateur des principes du Crédit Social.
Ce n'est pas du Manning. Ce n'est pas du Bennett. Eux disent : Il ne peut être question de Crédit Social provincialement. Ce n'est pas du Thompson, le leader actuel du parti "Onto-Ottawa". Ce n'est pas du Caouette, qui proclame qu'il faut aller à Ottawa et ne pas perdre son temps à chercher des remèdes dans des mesures provinciales, que les provinces sont impotentes. Il' accepte le point de vue poussé par la haute finance.
Tous ces petits esprits osent se servir du nom de Douglas, parer leur parti du nom de sa doctrine, alors qu'ils piétinent tous les points de vue et toutes les déclarations de cet homme de génie.
Quand toute la population de l'Alberta pensait encore en termes de Crédit Social, le gouvernement Manning renonça définitivement — et le déclara ouvertement — à tout nouvel effort pour instituer une économie créditiste provinciale. Il rendit les armes. Le résultat, c'est qu'aujourd'hui, le Crédit Social doctrine n'est plus en Alberta que de l'histoire ancienne. Le peuple albertain ne pense plus provincialement qu'en termes de "bon gouvernement"; satisfait de l'administration de Manning, il le maintient au pouvoir. Et fédéralement, les Albertains, fermiers, pensent surtout en termes de vente de blé, fût-ce à la Chine ou à la Russie.
Mais de voir des gens qui parlent encore en termes de Crédit Social prétendre en obtenir la réalisation en prenant de la distance, en "élargissant le problème", c'est grand' pitié, vraiment.
Au juste, la lutte pour le droit de l'Alberta à l'utilisation directe de son propre crédit réel ne dura que deux années; mais elle eut au moins le mérite de montrer quelle puissance domine les gouvernements centraux. Tandis que l'On-to-Ottawa, lancé en 1947, n'a rien donné après 16 ans, sauf de démontrer la futilité de poursuivre une réforme de l'importance du Crédit Social par de simples luttes électorales, en soumettant une doctrine, après l'avoir passablement émondée, aux aléas de l'urne électorale. Le Major Douglas conseillait donc de choisir entre trois formules :
La première : Passer outre à une Constitution qui protège un système adversaire du bien commun et générateur de maux graves et innombrables. Mais cela demande un peuple prêt à suivre son gouvernement. En 1944, je posais moi-même un jour la question à Solon Low, alors encore trésorier provincial de l'Alberta : "Pourquoi Aberhart, et plus tard Manning, n'ont-ils pas passé outre aux objections d'Ottawa ou d'autres sources, en disant : C'est la volonté prépondérante du peuple albertain ?" Solon Low me répondit : "Le peuple n'aurait pas suivi". — "Et pourquoi donc n'aurait-il pas suivi, puisqu'il avait si majoritairement voté créditiste ?"— "Ah !" fut la simple réponse de M. Low.
Le vote, il est vrai — et nous le comprenons mieux encore aujourd'hui — ne signifie pas grand' chose : il est bien plus le fait d'une masse cuisinée que l'expression de la volonté déterminée d'un peuple éclairé. D'ailleurs, les Albertains l'ont démontré une fois de plus, lorsqu'ils ont fait plus confiance au système des banques, système qu'ils avaient dénoncé, qu'au système des Succursales du Trésor, établi par un gouvernement pour lequel ils avaient voté.
La deuxième manière exprimée par Douglas, c'est de "contourner" les termes d'une loi qui veut s'opposer à la liberté de s'affranchir provincialement d'entraves purement financières.
Ce contournement pourrait se faire par l'institution d'un système de comptabilité interne, pour les transactions internes relatives à la production et à la distribution. Système tenu par un organisme provincial, relevant du ministère provincial des Finances (Trésor provincial), avec fonction de conformer cette comptabilité aux faits économiques dé la production et de consommation dans la province, pourvoyant à des facilités pour les transactions avec l'extérieur. Un peu comme le système des Succursales du Trésor établi en Alberta par Aberhart en 1938. Mais, comme nous l'avons vu ci-dessus, cela exige un peuple à la fois renseigné, prêt à collaborer en tournant le dos au système bancaire actuel dans toute la mesure qui lui en est offerte.
La troisième manière, c'est de "faire modifier le texte de la loi servant de Constitution." Mais là encore, il faut un peuple prêt, à mettre tout son poids à obtenir cette modification. C'est encore Douglas qui le dit : "Cela, à mon avis, ne peut se réaliser qu'au moyen d'une pression Concertée de toute la population".
Une pression concertée de toute la population ne peut jamais être le fait d'un peuple divisé par des partis politiques. Encore moins quand l'un de ces "diviseurs" se donne l'étiquette Crédit Social, et qu'il cherche justement à éloigner les créditistes du maître Douglas et les invite à faire confiance à des poursuivants de pouvoirs, d'honneurs et d'argent.
* * *
Il y a là matière à réfléchir, pendant la présente compagne électorale, pour ceux qui disent vouloir le Crédit Social. Feront-ils confiance au maître, ou suivront-ils des politiciens ?
Il est vrai que les atmosphères d'élection ne sont guère propices au resplendissement de la vérité. Mais notre devoir est tout de même de faire écho à la pensée du fondateur du Crédit Social, même au milieu de tout le tapage provoqué par ceux qui le trahissent. Il reste, après tout, des gens qui savent' tête garder, et c'est bien parmi les lecteurs réguliers de Vers Demain qu'on doit surtout pouvoir les trouver.
Ce n'est pas un "nouveau parti", mais un "peuple nouveau", un peuple de citoyens renseignés, formés à la responsabilité personnelle, qui fera instituer l'économie nouvelle, l'économie du Crédit Social telle que conçue par le maître Douglas.

Cet article a été publié par

Goldman Sachs mafia

$
0
0


Banks create credit money when they spend into the real economy, so the money is created without debts nor taxes, ex nihilo. Banks can have the whole world without really paying, sic... unlimited in many countries, as in Canada...


Any person or any organization who can create practically at will sums of money equivalent to the price values of all the goods produced by the community is the virtual owner of those goods, and, therefore, the claim of the banking system to the ownership of the money which it creates is a claim to the ownership of the country.[18, C.H. Douglas ]


As a quick reminder (thanks to Wikipedia) here is a partial list of how just one bank has managed to get its alumni into a huge number of key positions:


Olusegun Olutoyin Aganga– Former Nigerian Finance Minister, current Nigerian Minister for Trade and Investments
Claudio Aguirre– Led most of the privatization of Spanish government assets in the 1990s, including Telefónica, Repsol and Endesa
Erik ÅsbrinkMinister for Finance of Sweden (1996–1999)
Ziad Bahaa-Eldin– Deputy Prime Minister of Egypt (2013–)
Stephen Bannon - Former executive chairman of Breitbart News LLC, and Chief Executive Officer of the Donald Trump presidential campaign, 2016
Joshua Bolten– Former White House Chief of Staff
Mark Carney– Governor of the Bank of England (2013–) and former Governor of the Bank of Canada(2008–2013)[3]
Efthymios Christodoulou– Governor of the Bank of Greece (1991–1993)
Petros Christodoulou– General Manager of the Public Debt Management Agency of Greece (2010–2012) and Deputy Chief Executive Officer of the National Bank of Greece (2012–)
Michael Cohrs– Member of Court and the Financial Policy Committee at the Bank of England
Jon Corzine– Former CEO of MF Global, Inc., former DemocraticGovernor (2006–2010) and U.S. Senator (2001–2006), New Jersey
Guillermo de la DehesaSecretary of State of Economy and Finance of Spain (1986–1988)
Vladimír DlouhýMinister of Industry and Trade of the Czech Republic (1992–1997)
Mario DraghiPresident of the European Central Bank (2011-)
Rahm EmanuelMayor of Chicago (2011–)[4]
Henry H. Fowler– Former United States Secretary of the Treasury (1965–1969)
Judd GreggGovernor of New Hampshire (1989–1993) and United States Senator from New Hampshire (1993–2011)
Guy Hands– CEO of Terra Firma Capital Partners
Jim Himes– member of the House of Representatives (2009–present), representing Connecticut
Reuben Jeffery IIIUnder Secretary of State for Economic, Business, and Agricultural Affairs (2007– )
Neel Kashkari– Former Interim Assistant Secretary of the Treasury for Financial Stability (2008–2009)
Gianni Letta– Secretary to the Council of Ministers of Italy under the governments of Silvio Berlusconi
Ian Macfarlane– Governor of the Reserve Bank of Australia (1996–2006)
Tito Mboweni– Governor of the Reserve Bank of South Africa (1999–2009)
Karel Van Miert– European Commissioner for Transport and Consumer Protection (1989–1993) and European Commissioner for Competition (1993–1999)
Carlos Moedas– European Commissioner for Research, Science and Innovation
Mark Patterson– Chief of Staff to the Secretary of the Treasury of the United States (2009–)
Henry Paulson– Former United States Secretary of the Treasury (2006–2009)
Romano ProdiPrime Minister of Italy (1996–1998, 2006–2008) and President of the European Commission (1999–2004)[6]
Robert Rubin– Former Secretary of the Treasury of the United States, ex–Chairman of Citigroup
Gene Sperling– Director of the National Economic Council (2011–)[7]
Lawrence Summers– Secretary of the Treasury of the United States (1999–2001)[8]
Peter Sutherland UN representative for refugees; former EU commissioner; former attorney general of Ireland; Chairman Emeritus of GS International.
John Thain– Former Chairman and CEO, Merrill Lynch, and former chairman of the NYSE
Massimo Tononi– Treasury Undersecretary of the Ministry Of Economy and Finance of Italy (2006–2008)[6]
Malcolm TurnbullPrime Minister of Australia (2015- )
Robert ZoellickUnited States Trade Representative (2001–2005), Deputy Secretary of State (2005–2006), World Bank President (2007–2012)
Elisha Wiesel - chief information officer of Goldman Sachs

Pédo-criminels en Suisse ?

$
0
0
Révolté par les implications financières liées à l’événement « Saga des Géants » de la compagnie Royal de Luxe !


Sur cette image un « géant » se délecte d’une sucette. Au premier plan vous verrez de quel genre de sucette il s’agit. Ai-je besoin de vous expliquer ce qu’une sucette évoque dans l’esprit d’un « géant » pédophile ??? Cette production est de nature à favoriser le passage à l’acte auprès d’une personne troublée. Elle pervertit la jeunesse, incommode les passants et tombe probablement sous le coup de l’art. 197 du Code pénal.


De l’autre côté, un panneau indique «Montre-moi ton cadeau ». Ai-je besoin de vous expliquer ce que le mot « cadeau » évoque dans l’esprit d’un pédophile ?


Cette image tirée du livre Royal de Luxe 2001 – 2011  (Actes Sud) résume le concept de la Saga des géants « Toucher les rêves des doigts de pieds ».  Qui touche qui ici ? Avez-vous besoin d’une leçon de grammaire ? Le sujet de la phrase est « doigts de pieds » et ces gros doigts de pieds touchent des enfants.


Mais c’est autre un aspect de cette affaire, plus sombre encore, qui aurait dû retenir votre attention : la multiplication des événements à caractère pédophile ( pédo-criminels ). Dois-je vous rappeler que lorsque une manifestation destinée aux enfants est organisée, les organisateurs sont tenus de prendre un certain nombre de précautions visant à protéger les droits de la personnalité des enfants? A titre d’exemple, le vocabulaire employé ou l’iconographie sont soumis à des exigences accrues. Il n’en est pourtant rien. Ainsi, début octobre, à Lausanne du matériel a été largement distribué où un petit garçon, vu de dos, a été forcé de porter un panneau « plaisir ». Est-il nécessaire que je vous explique ici le genre d’association d’idées qu’un tel matériel est susceptible de provoquer en  l’esprit d’un pédophile???  


En ce qui concerne la Saga des Géants, je vous prie de considérer ce qui suit : cet événement a attiré 850 000 personnes dont de nombreux enfants. A cela s’ajoutent les événement périphériques comme ci-dessous en gare de Cornavin où transitent chaque jours des milliers de personnes.

Inutile de multiplier les exemples.

« On se demande qui tire les ficelles en coulisses » Soit!

Citoyennes et citoyens de Genève agissez, investiguez et traduisez en justice ceux qui répandent du fumier à vos frais sans quoi, et en particulier si la croix gammée à peine déguisée du Marchethon devait devenir plus visible,  il est à craindre que la Saga des Géants ne connaisse un triste épilogue.  

Vous pouvez vérifier votre réponse en pièce jointe (image tirée du site internet Royal de Luxe le 12.10.2017).


Image tirée du livre Royal de Luxe 2001-2011, Actes Sud. Compagnie préparant des événements pour enfants.

C'est le moment que cette affaire sorte du bois car j'ai été atterré par le silence assourdissant des milieux culturels au sujet de cette dépense de prestige aussi monstrueuse qu'inutile. Est-ce que dans les 2.4 millions annoncés figurent le million de la sécurité (certainement un peu plus avec l'hélicoptère qui a survolé la ville en permanence durant trois jours!). Comment valider une telle démesure alors que tous les lieux de création et d'expression artistique et socio-culturels sont menacés de baisses de subvention drastiques? Ce grand n'importe quoi que l'on nous a infligé dans une ville morte pour des raisons d'affaires (ratées) et de sécurité est une honte pour toute citoyenne et citoyen responsable!
Merci notamment à P. G. d'avoir soulevé le lièvre.


En 1968, dans la cathédrale de Fribourg, Daniel Pittet, neuf ans, rencontre le père Joël Allaz, qui l'invite à le suivre dans son couvent. Le calvaire de l'enfant débute : durant quatre ans, Daniel sera violé par ce prêtre capucin. Vingt ans plus tard, en 1989, il trouve le courage de dénoncer son abuseur aux autorités de l´Église. En 2017, il publie un livre, au titre déroutant : Mon Père, je vous pardonne, parce qu´il considère son violeur comme un malade. Le pape François a souhaité en personne préfacer son livre : « Je remercie Daniel car des témoignages comme le sien font sauter la chape de plomb qui étouffait les scandales et les souffrances, ils font la lumière sur une terrible obscurité dans la vie de l´Église. » Parce que les images parlent souvent davantage que les livres, Daniel a demandé à KTO de recueillir son témoignage pour que chacun, à commencer par les responsables de l´Église, prenne conscience de ce que vivent les victimes, pour que les victimes se comprennent elles-mêmes et puissent se remettent debout et enfin pour tenter de prévenir de tels drames. Un film de Philippine de Saint Pierre, réalisé par Alic Bonneton. Production KTO Télévision - 2017. Documentaire du 06/10/2017.


Pendant quatre ans, de l’âge de 9 ans à l’âge de 12 ans, Daniel Pittet a « vécu une misère noire ». Sous couvert de l’accompagner spirituellement, un frère capucin de Fribourg, en Suisse, l’a violé à d’innombrables reprises et l’a tenu sous sa coupe. Daniel Pittet a raconté cette enfance dévastée dans un livre paru en février, Mon père, je vous pardonne (Philippe Rey, 220 pages, 18 euros). La préface lui a permis de trouver un écho considérable : elle est du pape François.

La chaîne de télévision catholique KTO consacre à Daniel Pittet un documentaire sans fard sur les responsabilités internes de l’Eglise dans le parcours pédophile du père Joël Allaz. A 58 ans, Daniel Pittet raconte les mécanismes de sa sujétion à ce prêtre, ses supérieurs qui savent mais détournent le regard, la mère qui ne veut pas voir, sa certitude qu’on ne le croira pas. Seule une grand-tante lui viendra en aide. Supérieure ­générale des sœurs de Saint-Paul, un couvent où l’enfant est placé un temps, elle comprend que le petit va mal. Un jour, elle l’interroge sur ce qu’il fait trois jours par semaine chez le prêtre. « Ma tante, je ne peux pas vous le dire. » « Eh bien, tu n’iras plus. Va le lui dire tout de suite. » L’enfant y va, se fait « violer pour la dernière fois » et s’entend dire par le capucin : « Tu ne m’intéresses plus de toute manière. Tu peux aller chez un autre confrère. » Et il lui donne le nom de ce « confrère ».
Mécanismes de déni

Suivent des années d’occultation des violences subies et d’intense mal-être. Un jour, en 1989, il croise un enfant de 8 ans qui « n’a pas l’air d’aller fort ». « Il y a quelqu’un qui touche ton zizi ? », lui demande-t-il. L’enfant répond oui. C’est le père Joël Allaz. Pour Daniel Pittet, qui croyait être la seule victime, comme bien des enfants abusés, « c’est un coup de tonnerre ». Il fonce à l’évêché, parle de l’enfant, de son propre passé, et menace la hiérarchie : « Si vous ne faites rien, c’est moi qui déposerai plainte. » On l’interroge sur son histoire. Il est alors contraint « d’ouvrir [s]a tombe » et de se remémorer tout au cours de « semaines horribles ». On lui promet d’écarter le prêtre coupable et de le fairesoigner.

image: http://s2.lemde.fr/image/2017/10/06/534x0/5197439_6_4cbe_2017-10-04-8280e9b-26239-1ra6uk9-x36gdp9zfr_8e867d08ba16e1e443cb40bd7ee34687.png


En fait, Joël Allaz est seulement déplacé. Et pendant des années, il continue d’agresser des enfants. Il reconnaîtra plus tard en avoir violé plus de 40 au cours de sa « carrière », qui le conduira aussi en France, à Grenoble. Daniel Pittet apprend, en 2002, que le prêtre est toujours en activité et qu’il a récidivé. Il comprend que la hiérarchie lui a menti. Il commence à témoigner dans les médias suisses, d’abord à visage couvert.

Le film met en lumière les mécanismes de déni propres à l’Eglise. Un prêtre, Joël Pralong, spécialiste des questions de pédophilie, y témoigne qu’au sein de l’Eglise, « on a peur » de ce sujet. L’auteure du film, Philippine de Saint-Pierre, directrice générale de KTO, assume ce point de vue : « Oui, l’Eglise a mal géré ces affaires pendant des décennies, oui, il faut avancer. » C’est justement pour cela que la chaîne catholique a décidé de réaliseret de produire entièrement ce documentaire. « Chez les catholiques, explique Philippine de Saint-Pierre, il y a parfois la tentation de dire que ce sujet est une arme utilisée par des médias qui n’ai­ment pas l’Eglise. Nous, nous aimons l’Eglise, c’est pour cela que nous avons voulu le faire. Nous sommes dans une démarche ­ecclésiale de vérité. » Daniel Pittet est demeuré un fervent croyant et un catholique actif. « Il n’est pas dans une démarche de haine. On ne peut pas l’utiliser pour décré­dibiliser son témoignage », ajoute la journaliste.

Mon père, je vous pardonne, de Philippine de Saint-Pierre (Fr., 2017, 53 min).
http://www.lemonde.fr/televisions-radio/article/2017/10/06/tv-mon-pere-je-vous-pardonne-ou-le-calvaire-de-daniel-pittet_5197442_1655027.html

En savoir plus sur http://www.lemonde.fr/televisions-radio/article/2017/10/06/tv-mon-pere-je-vous-pardonne-ou-le-calvaire-de-daniel-pittet_5197442_1655027.html#QKwAW0K1Dl20KZ8x.99


Ils ont trop souvent le sursis ou la prescription...

LESSONS FROM A SPANISH

$
0
0


SPOTLIGHT: CATALAN LESSONS FROM A SPANISH SON IN SWITZERLAND

Antonio Rodriguez, who was born in Switzerland to immigrant parents from Spain, has an interesting vantage point on the Catalonia movement for independence. Here’s an excerpt of his article that appeared this week in the Geneva-based daily Le Temps:

"In the 1960s, when my parents' generation moved to Switzerland, they got a taste of what had been for them a forbidden fruit in the Francoist Spainthey'd left: democracy. They observed with surprise how the Swiss would go to the polls several times a year to express their opinion about issues as diverse as alcoholism or water pollution.

They soon became a political issue themselves, and they looked on, incredulous, as the Swiss were called to vote on the presence of immigrants in their country. I remember the anxiety of these two Sundays, in 1970 and 1974, as we waited for the result of these initiatives on capping immigration. Most of all, I remember our great relief when the news on TV told us we wouldn't have to pack our bags.

Thanks to their emigration, my parents' generation, the one that had grown up in post-civil war Spain, discovered that democracy wasn't the diabolical invention they'd been told about. In Switzerland, people were able to debate without breaking up with their families, to campaign without beating up the other side's flag bearer and to express their points of view without turning over the fondue pot in the middle of the table.

What a shame that Mariano Rajoy's parents didn't emigrate to the city of Delémont. There, their son would have experienced in full immersion the organization of a self-determination referendum. That was on June 23, 1974, when people from the Jura region voted to secede from the canton of Berne to create their own canton."

Read the full article (in English via Worldcrunch)

The real "problem", the odious debts coming from nowhere, ex nihilo...

http://desiebenthal.blogspot.ch/2017/10/how-much-money.html

New money...

By Mark Anderson / Stop the Presses News & Commentary
Also see http://www.thetruthhound.com
Society could be on the brink of an extremely vital renewal that, if clearly understood and boldly and intelligently implemented, could pave the way for far “calmer waters” economically, politically and socially.
I’m referring to the movement to give every adult in the United States a $1,000 cash “handout,” or dividend, per month. It apparently would grow the economy by $2.5 trillion by the year 2025, according to a new study by the Roosevelt Institute on what’s known as a “universal basic income.”
This is essentially the same proposal that Swiss voters narrowly defeated last summer. Roosevelt research director Marshall Steinbaum, Michalis Nikiforos at Bard College's Levy Institute, and Gennaro Zezza at the University of Cassino and Southern Lazio in Italy co-authored the study.
“The study made economic forecasts for three proposals: a full universal basic income in which every adult gets $1,000 a month ($12,000 a year), a partial basic income in which every adult gets $500 a month ($6,000 a year) and a child allowance in which parents get $250 a month ($3,000 a year),” CNBC online reported.
“A $1,000 cash handout to all adults would grow the economy by 12.56 percent after eight years . . . . Current Congressional Budget Office estimates put the GDP at $19.8 trillion. The cash handout would therefore increase the GDP by $2.48 trillion,” CNBC continued. “The $250 allowance would grow the GDP by 0.79 percent and a $500-a-month payment would grow the GDP by 6.5 percent.”
But here is where things begin to wobble. These estimates, says CNBC, “are based on a universal basic income paid for by increasing the federal deficit.”
Researchers also calculated what would happen if the cash dividends paid to the people were offset by increasing taxes. In that case, there were would be “no net benefit” to the economy.
“When paying for the policy by increasing taxes on households rather than paying for the policy with debt, the policy is not expansionary,” the report says, presenting false alternatives. “In effect, it is giving to households with one hand [while] taking away with the other. There is no net effect.”
WHAT'S WRONG WITH THE STUDY
The glaring gap in this Roosevelt study is that it overlooks the key thing that would actually make a regular citizen dividend work: We have to avoid money transfers based on redistribution, where we tax one segment of society in order to pay out the dividend—just as we must avoid more borrowing, which creates a larger deficit and more debt.
Instead, we must create new money interest-free through the Article I constitutional power of Congress. In other words, ladies and gentlemen, we’re facing a financial, political and social abyss and we have to know exactly how to proceed.
Adopting this proper process would necessarily mean that the banking system’s monopoly of money creation would be trimmed or possible ended altogether. In that vein, take note that the real fourth branch of government has nothing to do with the press; instead, it’s the financial-monetary power along with the legislative, executive and judicial branches. In 1913, however, the U.S. government surrendered its money power to the newly created, privately owned Federal Reserve System and that power must be reclaimed.
2017 is the 100th anniversary of British engineer C.H. Douglas’s discovery of “social credit,” which, strictly speaking, is a broad monetary-societal reform that contains the proper formula for solving a real problem.
During his in-depth engineering work for the British government, Douglas found that the manufacture of goods racks up costs and creates prices far in excess of the purchasing power that it also meagerly creates through wages and salaries.
This is not some abstraction. Once Douglas confirmed this mathematical gap, he advanced “social credit,” wherein a dividend is regularly paid to the people to the same extent, per production cycle, that there’s a shortfall in purchasing power when goods come off the production line, steeped in production costs, including labor costs.
Douglas knew that the dividend had to come from somewhere other than the labor market. In other words, society needs a direct infusion of a properly calculated dividend that is not work-related. That way, the dividend does not become just another labor cost that’s automatically embedded in the final prices of goods and services.
But the overriding point is that social credit solves the problems cited in the Roosevelt study, while also answering the urgent call to society that more and more automation is on its way.
Widespread automation, if not accommodated, could bring forth several problems, but many people don't realize how it can be the key to much more leisure and freedom—as long as we carefully devise and issue a sufficient dividend to supplement people’s work incomes, even while human labor inevitably becomes less and less of a requirement to produce abundant goods due to the super-efficiency of the machine.
With that we combine the "wage of the machine," which negates the deflation inherent in constantly roaring at the oars of a slave economy that always lacks debt-free purchasing power, which means the economy careens near a steep cliff nonstop due to a profound lack of demand. Goods are profuse but buying power is slight, which gives way to the expression "full stores and empty wallets." Early-20th century social credit author and promoter Louis Even referred to the situation as "poverty in the midst of plenty."
And those who make the easy refrain that this is "socialism" need to read Dr. Oliver Heydorn's book "Social Credit Economics" to realize that while the state owns it all under socialism, under social credit the state's limited role would be to establish a national credit office that would simply keep a national assessment, a ledger for calculating production data---on which to base the amount and frequency of the national dividend.
Thus, government would only provide a basic monetary and accounting "infrastructure" without interest and debt, but ownership and opportunity, as "economic democracy" expands via the dividend and other adjustments, would be diffuse, widespread and vibrant as more "capitalists" are created among a now dispirited and dejected populace that senses what's wrong but cannot name it. The present private banking and corporate plutocracy, rigging the system for itself, and buying politicians and the press as an extension of controlling money creation, simply has got to go.
So, can we take our noses off the grindstone and flourish? Yes, provided we pay careful attention to the snares and pitfalls and understand what we’re dealing with. I’d suggest reading some of the essays at http://www.socred.org among other sources, discuss the matter with associates and make your views known to policymakers.
Douglas once said that society could literally leave one civilization and enter another, a much better one, if we shake off outmoded financial shackles and carefully and bravely forge ahead. All the signs that Douglas predicted would someday materialize are there.
Courtesy of: The Money Project

Résultats de recherche


François de Siebenthal: Sovereign Debt and the Economy: What ...

desiebenthal.blogspot.com/2017/09/sovereign-debt-and-economy-what-happens.html

Sovereign debt is central to policy debates in both advanced and emerging economies. ...... Arnaque de la création monétaire du néant, ex nihilo... Grâce à ...

Goldman Sachs mafia Banks create credit money when they spend ...

https://plus.google.com/.../posts/GpdKqBu8WTc

Traduire cette page
Il y a 21 heures - Banks create credit money when they spend into the real economy, so the money is created without debts nor taxes, ex nihilo. Banks can have the whole world ...

François de Siebenthal: Total declared debts of USA, plus to add ...

desiebenthal.blogspot.ch/2008/10/total-declared-debts-of-usa-plus-to-add.html

If you add corp debts, we will ne near 100 trillions, to check the figures...Making even minimum .... You're subscribed to this list with the email siebenthal@gmail.com. For more ...... Arnaque de la création monétaire du néant, ex nihilo... Grâce à ...

François de Siebenthal - RSSing.com

siebenthal1.rssing.com/chan-29893992/all_p33.html

06/08/16--03:39: La BNS avoue la création du néant, ex nihilo. ... François de Siebenthal: Loi pour une démocratie économique ..... Financial engineering with the aim of moving Italian debt off-balance sheet; Manipulation of risk models with ...

An interview with a former Swiss banker - Michael Journal

www.michaeljournal.org/.../an-interview-with-a-former-swiss-ban...

Traduire cette page
He recently spoke to Francois de Siebenthal, who is a former banker from Switzerland. ... They have created massive amounts of credit (Ex Nihilo) as loans for real .... He had created debt-free "Greenback" notes for the United States as well, ...

François de Siebenthal: Les banques créent de la ... - Pinterest

https://www.pinterest.com/pin/207939707774464046/

Traduire cette page
Html. Les banques créent de la monnaie du néant, ex nihilo, de novo ... François de Siebenthal: En mémoire de Bernard Maris, + RIP ... The Walking Debt.

François de Siebenthal: Les banques créent de la ... - Pinterest

https://www.pinterest.dk/pin/207939707774464046/

Traduire cette page
François de Siebenthal: Les banques créent de la monnaie du néant, ex nihilo, de novo. ... debtburden ONS. ΠΡΟΣΚΛΗΣΗ.jpg. Fonte: Fed S.Louis. (26) Twitter.

Canada selling much of its gold http://globalnews.ca/news/2508940 ...

https://plus.google.com/.../posts/Qq4fXkRcFCu

Traduire cette page
12 févr. 2016 - It is a debt instrument, not one of wealth or even potential. THIS IS ROBBERY BY MONEY CREATION OUT OF NOTHING, EX NIHILO, DILUTION OF EVERYONE ...


FMI: Milliards qu' on ne reverra jamais

$
0
0

Le Conseil fédéral décide d’un prêt bilatéral au Fonds monétaire international

Berne, 12.10.2017 - Lors de sa séance du 11 octobre 2017, le Conseil fédéral a fixé la date d'entrée en vigueur de la révision de la loi sur l'aide monétaire (LAMO) au 1er novembre 2017 et décidé que la Suisse accorderait un prêt de 8,5 milliards de francs au Fonds monétaire international (FMI).
La LAMO autorise la Confédération à accorder une aide monétaire sous forme de prêts, de garanties et de contributions à fonds perdus. Il a fallu réviser cette loi car la pratique en matière d'octroi de crédits au niveau multilatéral a évolué. La principale modification de la loi porte sur le prolongement, de sept à dix ans, de la durée maximale de l'aide monétaire. Avec l'entrée en vigueur de la révision de la LAMO, les conditions seront désormais remplies pour que la Suisse puisse octroyer au FMI un prêt bilatéral prévoyant un délai de remboursement de dix ans. Le Conseil fédéral a chargé la Banque nationale suisse (BNS) d'accorder au FMI un prêt d'un montant de 8,5 milliards de francs. La Confédération garantit à la BNS le remboursement du prêt dans les délais.
La participation de la Suisse s'inscrit dans le cadre du renouvellement des lignes de crédit bilatérales accordées au FMI en 2012. En octobre 2016, le FMI a décidé de renouveler ces lignes de crédit pour un montant total d'environ 425 milliards de dollars, en raison des incertitudes qui continuent de peser sur la stabilité du système financier. Ces ressources visent à garantir que le FMI dispose de moyens appropriés pour remplir de manière fiable et efficace son mandat de stabilisation du système monétaire et financier international en cas de crises graves. Dotée d'une économie ouverte, d'une importante place financière et de sa propre monnaie, la Suisse est tributaire de la stabilité du système financier et monétaire international, dans lequel le FMI joue un rôle de soutien, voire de bouclier face aux risques systémiques.

Adresse pour l'envoi de questions
Anne Césard, Communication du Secrétariat d'État aux questions financières internationales SFI
n° tél. +41 58 462 62 91, anne.cesard@sif.admin.ch

Auteur
Conseil fédéral
https://www.admin.ch/gov/fr/accueil.html 

Département fédéral des finances
http://www.dff.admin.ch 

"Catholics" do not follow the Popes

$
0
0

"Catholics" do not follow the Popes


Benedict XIV, Gregory XVI, John Paul the second and Francis

Infinite interest rate ?


They say, interest rate was never so low, but In fact, it is a big lie because the interest rate is going to infinity...
Why ?
Because they create the capital in an unlimited way out of nothing,
then, if you create an infinity of capital, the interest rate becomes itself infinite, and this lead to an infinite economical war, killing millions of the poorer.
They lie to everybody all the times since a long time. They cheat all balances...
The different guise is this money creation out of nothing, out of thin air, ex nihilo in latine,  allowing them to infinite control of everything and everybody and every souls.


3...The mischief has been increased by rapacious usury, which, although more than once condemned by the Church, is nevertheless,under a different guise, but with like injustice, still practiced by covetous and grasping men....

NO limits in money creation...by Dr. Pinar Yesin, University of Zurich

http://desiebenthal.blogspot.ch/2013/02/infinite-interest-rate.html

Is the Vatican catholic ?

The love of money is the root of all evil.


The Vatican and IOR, see the report below, are not following the encyclical Vix pervenit.

Roma locuta, causa finita... Rome has spoken, the cause is closed... Any rate of interest kills millions of human beings...

Explanations: 


https://vimeo.com/136794177


http://desiebenthal.blogspot.ch/2015/12/swiss-positive-money-social-credit.html

http://www.papalencyclicals.net/Ben14/b14vixpe.htm


https://en.wikipedia.org/wiki/Vix_pervenit


http://www.ior.va/content/dam/ior/documenti/rapporto-annuale/IOR-Annual%20Report%202016.pdf


Invitations 2017
In English

 23, Av. Edouard Dapples, CH 1006 LAUSANNE. SUISSE

Tél: international ++ 41 21 616 88 8

http://desiebenthal.blogspot.ch/2015/12/swiss-positive-money-social-credit.html

François de Siebenthal: The love of money is the root of all evil.

desiebenthal.blogspot.com/.../love-of-money-is-root-of-all-evil.ht...

Traduire cette page
3 mai 2009 - Jesus said that the love of money is the root of all evil. This had no meaning for me (although I thought it did) until I read and studied the Social ...

François de Siebenthal: Money creation management by the Swiss ...

desiebenthal.blogspot.com/2013/10/money-creation-management-by-swiss.html

9 oct. 2013 - At least, the SNB controls and limits the money creation and the profits are ... Be praised, my Lord, through those who forgive for love of you; ...

François de Siebenthal: Games to explain money sytems

desiebenthal.blogspot.com/.../games-to-explain-money-sytems.htm...

Traduire cette page
25 déc. 2016 - You know that money is created in the form of debts with interest ..... It is really a way to avoid this love of money which is the root of all evils.

The love of money is the root of all evil.Social credit is a solution ...

https://groups.google.com/d/topic/social-credit/x8nMw0Lq5d0

Traduire cette page
7 févr. 2017 - François de Siebenthal: Games to explain money sytems ... 2016 - It is the love of money that is the root of all evil, and with this system, there is ...

François de Siebenthal: Federal Council adopts monetary policy report

desiebenthal.blogspot.ch/2016/12/federal-council-adopts-monetary-policy.html
23 déc. 2016 - He recently spoke to Francois de Siebenthal, who is a former banker from ..... Helicopter Money: Or How I Stopped Worrying and Love ...


How illuminati are lying, arguments and video from Julian Simon ...

desiebenthal.blogspot.com/2008/08/how-illuminati-are-lying-arguments-and.html

11 août 2008 - François de Siebenthal ... Julian Simon said in his book " the ultimate Resource 1" that he was paid ... Play list for all Julian L. Simon 's videos.

François de Siebenthal: What overpopulation ???

https://desiebenthal.blogspot.com/.../what-overpopulation.html?m=...

Traduire cette page
15 févr. 2014 - Steve Moshe and Julian Simon : Human beings are the ultimate resource." Confessions of an economic hitman. overpopulation propaganda.

An interview with a former Swiss banker - Michael Journal

www.michaeljournal.org/.../an-interview-with-a-former-swiss-ban...

Traduire cette page
He recently spoke to Francois de Siebenthal, who is a former banker from ... Julian Simon said in his book "The Ultimate Resource 1" that he was paid by those ...June 12, 2017, Monday
The Vatican Bank Is Reporting A 20 Million (c. $22 Million) Increase In Profits

How much money does the Vatican bank have?

About 5.7 billion euros. (That is about $6.3 billion.)

But most of it is not the Vatican's money -- it is the money of thousands of depositors, like religious orders, and bishops, and cardinals.

These depositors have a total of 14,960 accounts at the bank -- down several thousand in the past two years due to Francis' reform efforts. (The Vatican has spent almost four years now combing through the thousands of bank accounts, and closing many down. As Christopher Lamb reported today forThe Tablet (link), "Over the years the IOR had been mired in scandal with accusations that it was being used for money laundering and failing to abide by international financial standards.")

The actual amount of the Vatican's own money at the Vatican bank is a much more modest 636.6 million euro -- about $700 million.

And what does the Vatican do with these funds? Does the IOR invest them in Apple stock, or Tesla, or Priceline? Or in commodities like oil or gold? Or in real estate? Bonds? And if in bonds, the bonds of which countries?

If you are looking for answers to such questions, you won't get them from the Annual Report that the Vatican released today on the 2016 activity of the Vatican bank -- officially called the Istituto per le Opere di Religione(Institute for the Works of Religion, commonly referred to as the IOR).

Here is a link to the actual text of the report, which is a 136-page PDF file, so you may open the file and read the entire report in English. (And I would be happy to receive any insight from a reader into the information this report contains, and what it means.)

There is no record anywhere in this report of the Vatican investing in stock like Apple or IBM or Facebook, or in Italian government 10-year treasury notes.

The results do give certain overall numbers.

For example, as stated at the outset, the total amount of money that the bank manages is about 5.7 billion euros (about $6.3 billion).

That may seem like a lot. And some might speculate, for example, that the Vatican might have earned a profit of, say, 5%, on all of those funds and investments, so, perhaps $315 million...

But that would be off target...

The results show that the bank had 36 million euros in profit, or a bit more than 1% of the total under management. And that is an increase of 20 million euros above the 16 million euros in profit the bank earned in 2015.

"These results," writes Christopher Lamb, "will be seen as a boost for Pope Francis’ Vatican financial reforms, which he has entrusted to Australian Cardinal George Pell. Soon after taking over as Prefect of the Secretariat of the Economy, Cardinal Pell announced a new management of the bank, including appointing billionaire hedge fund guru Michael Hintze to its board."

Lamb also writes: "In the 1970s and 80s, the bank was embroiled in the collapse of two Italian banks, including 'Banco Ambrosiano', whose chairman, Roberto Calvi, was later found hanging from Blackfriars bridge.Crisis then hit in January 2013 when Italy’s central bank blocked all electronic payments through cash machines and credit cards in Vatican City State, caused partly by the IOR failing to keep up to speed with new anti-money laundering rules. These laws were brought in following 9/11 in order to prevent the financing of terrorism. All this meant some cardinals wanted Pope Francis to close down the bank, arguing that St Peter did not have a bank account. This was a view shared by Francis but he later agreed to keep the IOR open provided it was reformed."

A Step Back

Let's take a step back. What is the Vatican bank, and how does it earn its money?

The IOR administers about 15,000 accounts worldwide for religious orders, various Church organizations, and individuals.

Through the bank, the Holy See helps its depositors to move funds to support religious initiatives, like missions, convents, schools and clinics, in places from Brazil to South Sudan to India.

"The IOR strives to serve the global mission of the Catholic Church through the administration of the entrusted assets and providing payment services to the Holy See and related entities, religious orders, other Catholic institutions, clergy, employees of the Holy See and the accredited diplomatic bodies," the report states (p. 13).

The bank invests the funds entrusted to it in very conservative ways, the report says.

"On behalf of its clients," the report says, "the Institute carries out financial activities... and offers the following services: acceptance of deposits, asset management, certain custodial functions, international payment transfers through correspondent banks, and holding salary and pension accounts of employees of the Holy See and the Vatican City State. The Institute protects its clients’ assets by primarily investing in financial instruments characterized as very low risk (e.g. government bonds, bonds issued by institutions and international organizations, as well as deposits in the interbank market)." (pp. 13-14)

So, can we get a clearer idea of who actually uses the bank?

"Measured by assets entrusted, the most important group of clients, was religious orders," the report states. "They accounted for more than half of our client base in 2016 (54%), followed by Roman Curia departments, Holy See Offices and nunciatures (11%), entities of Canon Law (9%), cardinals, bishops and clergy (8%), episcopal conferences, dioceses and parishes (8%), with the remainder split between various others, such as Vatican employees and pensioners and Canon Law foundations." (p. 25)

One question I have is why among the clients there can be a few "dioceses and parishes" (if they have 8% of the total asset under management of $6.3 billion, then they have some $500 million on deposit at the bank) and not an account for every diocese and parish in the world. Why not? I do not know the answer to that question. Of course, having every Catholic diocese and parish in the world open an account at the Vatican bank would arguably make the Vatican bank, for funds deposited, one of the largest, if not the largest, in the world.

The report explains the income figures this way: "In 2016, IOR’s Net profit was EUR 36.0m (2015: EUR 16.1m). The increase from 2015 was mainly due to improved results from Net Income for trading activities, to theremeasurement of a provision for tax remediation to foreign countries recognized in 2015 and to the decrease in Administrative expenses... The most significant source of revenues is the profit derived from Treasury activities on proprietary portfolios. The most important component was derived from bond yield which contributed for EUR 39.6 million (interests EUR 38,0 million plus trading results EUR 1.6 million)." (p. 25)

So, from this passage we learn that the increase in income that the Vatican bank earned in 2016 derived from:

1) trading activities gave improved results

2) recalculating taxes owed to various countries (apparently, recalculating down) allowed higher profits

3) less overhead in the offices themselves enabled greater profits

4) bond yields provided almost all of the profits

The report says "bond yields" provided 38 million euros, and "trading in bonds" 1.6 million euros, for a total of 39.6 million of profit during 2016.

And the total profit for the year was only 36 million euros. So there had to be some losses somewhere else.

And there were. In trading activities.

The report says, "Net Income for trading activities recognized a net loss of EUR 9.0m compared to a net loss of EUR 15.4m in 2015." 

So, both in 2105 and 2016, the IOR traders lost millions of euros.

"The result," the report says, "was mainly affected by the decrease in UCI unit investment compared to 2015, amounting to EUR -12.8 million. The improvement in the results was mainly due to the positive performance of the bonds held in the proprietary portfolio in 2016, compared to 2015, to market trends during the year."

So, in short, there was a 12.8 million euro loss due to a decline in the "UCI unit investment" (not sure what that was, and I do not see it defined anywhere in the report).

So, from this report, we are told that the main culprit for the loss was a single "bad trade."

We are also told that the Vatican bank traders made a profit of... 94,000 euros (just a bit more than $100,000) in trading stocks(!).

"Equity securities," the report says, "recorded a profit of EUR 94,000 in 2016, versus a loss of EUR 307,000 in 2015, while FX activity contributed for EUR 2.0 million versus EUR 1.9 million in 2015." (FX activity refers to trading in currencies.)

Still, there is no list of stocks bought or sold. Again, we have no idea if the Vatican bank bought gold mining shares or technology stocks or bank stocks or consumer goods stocks -- such details are not part of this report.

We do glimpse a bank that is shedding employees, slowly.

"Administrative Expenses were EUR 19.1m in 2016 (2015: EUR 23.4m)," the report says. So there were 4.3 million euros less spent on administering the bank. 

The report continues: "This includes Staff Expenses of EUR 10.2m in 2016, in reduction with the prior year amount (2015: EUR 11.3m, or - 9.1%). As of December 31, 2016, the IOR had a total of 102 personnel (2015: 109). During the year, six employees retired and one resigned."

So, the banks spent 1.1 million euros less on salaries in 2016 than in 2015, and dropped from 109 to 102 staff people. (If those 7 people together were earning the 1.1 million euros saved, they were earning an average of 157,200 euros each, or close to $175,000 each.

And: "Administrative expenses also include expenses for professional services, which decreased from EUR 7.6m in 2015 to EUR 4.0m in 2016. This was due to lower extraordinary costs incurred during the year from the completion of certain projects."

So the bank spent 3.6 million euros less on "professional services" -- that is close to a $4 million saving.

We come to the "bottom line" results on page 129 of the report, where these figures are given (I give the text of the statement in italics):

The Financial Statements may be summarized as follows:

BALANCE SHEET
                                EUR000 [Note: meaning figures require adding 3 zeros]
Total assets                                       3,268,890
Total liabilities                                 2,596,290
Net assets                                            672,600

PROFIT AND LOSS ACCOUNT

Net result from financial activities     42,762
Net operating profit                            36,001 
Profit available for distribution         36,001   

The IOR Press Release explaining the 2016 statement is as follows:

Vatican City, 12 June 2017 – For the fifth year, the Istituto per le Opere di Religione (IOR) has published its financial statements.

The financial statements have been audited by the independent audit firm Deloitte & Touche S.p.A.

The Board of Superintendence of the Istituto per le Opere di Religione unanimously approved the 2016 financial statements on April 26 and proposed to the Cardinals Commission the distribution of the entire amount of profits to the Holy See.

In 2016 IOR has continued to serve with prudence and provide specialized financial services to the Catholic Church worldwide and the Vatican City state. The highlights are as follows.
  • In 2016 the IOR served nearly 15,000 clients worldwide who entrusted to the IOR assets worth Euro 5.7 billion at the end of the year (Euro 5.8 billion in 2015), of which Euro 3.7 billion related to assets under management and under custody. Many initiatives were taken throughout the year to increase customer focus in accordance with IOR’s mission.
  • The Institute continued to reduce its operational expenses, which decreased to Euro 19.1 million from Euro 23.4 million in 2015 notably due to rationalisation of contracts with service providers.
  • The 2016 operating income was Euro 44.1 million (Euro 45.4 million in 2015). The major contribution (Euro 46 million) came from the management of IOR’s balance sheet (proprietary portfolio). The net result was Euro 36 million (Euro 16.1 million in 2015).
  • This result has been achieved thanks to a prudent approach in managing IOR’s investments in a year characterised by high volatility, global political uncertainty due to unexpected outcomes of major electoral events and low interest rates.
  • As of 31 December 2016, the Institute’s equity -- net of distributed profits -- amounted to Euro 636.6 million, corresponding to a 64.5% CET1 ratio, highlighting high solvency and low risk profile.


  • Other achievements
    In addition to achieving those economic and financial results, the Institute has also met the organizational objectives envisaged by the 2016 business plan, among which the most important were:
IOR’s governance, risks control and compliance in general
The IOR has consolidated and strengthened its internal governance and internal control system. The Institute has notably defined and implemented a Risk Appetite Framework, and has continued to adapt to the new AIF regulatory framework whilst seeking consistency with international best practices.

Disclosure and tax matters with the Republic of Italy
The Agreement between the Republic of Italy and the Holy See on tax matters entered into force on the 15th of October 2016. It opened the way to the inclusion of the Holy See in the tax “white list” of the Republic of Italy on the 23rd of March 2017.

Visit www.ior.va website for further information.
The Moynihan Letters are posted here.

Note: The Moynihan Letters go to more than 21,000 people around the world. If you would like to subscribe, simply email me an email address, and I will add you to the list. Also, if you would like to subscribe to our print magazine, Inside the Vatican, please do so! We appreciate all new subscribers very much. You might even consider purchasing a gift subscription for a friend, a student, a grandchild, a parish priest. Thank you. To subscribe, click here.
What is the glory of God?

"The glory of God is man alive; but the life of man is the vision of God."—St. Irenaeus of Lyons, in the territory of France, in his great work Against All Heresies, written c. 180 A.D.

ANNUAL REPORT 2016
Istituto per le Opere di Religione
Cortile Sisto V
00120 Vatican City State
Vatican City State


Registered under No 1 in the Register of Legal Persons held at “Governatorato” of Vatican City State Authorization n. 1 of 10/07/2015 issued by AIF, to carrying out on a professional basis financial activities at Vatican City State digital copy on site www.ior.va “Money must serve, not rule.” His Holiness Pope Francis, Evangelii Gaudium, 2013 5 TABLE OF CONTENTS PRESIDENT OF THE COMMISSION OF CARDINALS’ MESSAGE 7 PRELATE’S MESSAGE 8 MANAGEMENT REPORT 9 CHAPTER 1. STRATEGIC INFORMATION 11 1. President of the Board of Superintendence’s Message 11 2. Mission, Customers and Services 13 3. Corporate Governance 14 4. IOR Organization Chart 21 5. Regulatory Framework and Tax Requirements 21 6. Proposal of Distribution of the Net Profit For the Year 26 CHAPTER 2. OPERATIONAL INFORMATION 27 1. 2016 Business Review 27 2. Forecast for 2017 28 FINANCIAL STATEMENTS 31 Balance Sheet 33 Income Statement 34 Statement of Comprehensive Income 35 Statement of Changes in Equity 35 Cash Flow Statement 36 Explanatory Notes 38 Part 1. Accounting Policies 38 Part 2. Information on the Balance Sheet 61 Part 3. Information on Income Statement 82 Part 4. Information on Comprehensive Income 92 Part 5. Information on Risks and Hedging Policies 95 Part 6. Information Concerning Equity 119 Part 7. Related Party Transactions 123 REPORT OF THE REVISORI 125 REPORT OF THE EXTERNAL AUDITORS 131 The present Annual Report has been translated from the original one which is prepared in Italian IOR Annual report 2016 7 PRESIDENT OF THE COMMISSION OF CARDINALS’ MESSAGE The presentation of an annual report provides a convenient opportunity to do a double internal examination. The first one relates to the last year and the second one refers to the current year, or better, the future years. It seems to me that this rule can be applied to the presentation of the IOR annul report for the year 2016. In it, like every human work, one can find anxieties of great success, overcoming complex or inherited situations, To offer a service appropriate for everyone’s mission, personal contribution to a cause that is worth serving for professional reasons or for high ethical, religious or humanitarian inspiration. I think this can be behind the figures presented in the IOR 2016 annul report. But along with the best dispositions and personal efforts, there is also the stubborn realities of global economic and financial performance and the recurrent volatility phenomena that often complicate predictions and expectations. In this complex context, during the year 2016, the effort of all the members of the large family of IOR, ecclesiastical or laity servants, each in its place of responsibility at the various levels, took place. But they come together to serve a global cause with that ethical and exemplary sense that the Holy Father rightly claims from us all and from each of us. This is His first directive and first requirement, and not efficiency at any cost. In this line, as President of the Commission of Cardinals, I feel the duty to express the most heartfelt thanks to the Cardinals, the Prelate, the Board Members, the Directorate, the Revisori and the whole staff of our Institute. Allow me to remind all of us that the Holy Father, as he has clearly indicated on several occasions, requires competent and effective collaborators, but always guided by inalienable ethical principles, both inside and outside, as servants of the Church. It is our duty to continue to improve our services in the years to come. IOR Annual report 2016 Cardinal Santos Abril y Castelló President of the Commission of Cardinals Istituto per le Opere di Religione 8 PRELATE’S MESSAGE I wish to add my own to the authoritative voices of the Cardinal President of the Commission of Cardinals’, the President of the Institute and the Director General simply to express my thanks to all those who, through their commitment and work, have over the past year contributed to renewing the way the Institute operates. Thanks to them, one step at a time, the IOR has increasingly been becoming an entity that serves the Church straightforwardly and in a humble way, aware of its importance in connection with supporting the Holy See’s and Catholic religious organisations’ practical activities, and developing a conscience whereby the Institute is no longer viewed almost as a separate and independent entity but rather as one that takes as the reason for its very existence its subordination to projects targeted only to the real needs of Catholics works and not to making money for the sole purpose of making money. If thanks to management centred on Catholic social ethics there is money, that is positive, and if for whatever reason at times there is less than expected, never mind. The Lord will always lend His support to those who trust in Him: even “re oeconomica”. In these days of Easter, the people who work in our Institute ought to reflect upon the words Pietro said to the lame man: “Silver or gold I do not have, but what I have I give you: in the name of Jesus Christ of Nazareth, get up and walk!” (Acts 4-6). So we must go forward bravely, without ever forgetting that there is One above us who guides events and this should give us confidence but also a great sense of responsibility. IOR Annual report 2016 Msgr. Battista Mario Salvatore Ricca Prelate Istituto per le Opere di Religione MANAGEMENT REPORT 11 CHAPTER 1 STRATEGIC INFORMATION 1. PRESIDENT OF THE BOARD OF SUPERINTENDENCE’S MESSAGE Sinceits appointment in July 2014, the Board of Superintendence has worked on the necessary transformation of the IOR to serve with Prudence the Holy Father in fulfilling his mission as Universal Pastor. This meant focusing on the nature and the quality of services offered to clients and to the Church in a complex financial environment, the establishment of a framework with stronger and clearer governance principles, strict compliance with applicable laws and regulations including anti-money laundering procedures, the improvement of internal controls and risk management, the execution of tax agreements with the United States of America and Italy, and the review of legal issues in coordination with the appropriate Vatican authorities. In 2016, the IOR has continued to make progress in rolling out the reform plan agreed upon by the Board, supported by the new Directorate and the work of all its employees. In doing so, the Board has given consideration to the words of the Holy Father regarding its particular responsibility and particularly “the responsibility of guiding the institute’s strategic development in accordance with its mission to serve, the Board should never lose sight of the ethical dimension of the choices made in providing strategic guidance, recognizing that ethics is first and foremost in governing the IOR, and may never be subordinated to profit, nor open to compromise”. Collaboration between the Board and the Directorate According to the Statute of the IOR, the Board has approved the business plan for 2016 which was the continuation of the 2015 plan with a core focus on ethics and customer satisfaction and has assisted the Directorate in its execution. It included the need to address the quality, reliability and sustainability of investment solutions offered as well as the technical support offered to IOR client base. In addition, the Board has worked with the directorate towards strengthening the overall organization including: 1. Ensuring compliance with law XVIII and Regulation No.1; 2. Strengthening the control functions with clearer governance principles; 3. Addressing human resource issues, such as increasing staff training, strengthening internal communication, and hiring appropriate resources; Jean-Baptiste de Franssu President of the Board of Superintendence Istituto per le Opere di Religione IOR Annual report 2016 12 4. Consolidation of the IT infrastructure; 5. Revising and strengthening the existing governance policy where necessary; 6. Continuation of the efforts of building new relationships with Italian banks, particularly in the context of the tax agreement with Italy; 7. Continuing to reduce administrative costs, including dependency on outside consultants; 8. Developing a Risk Appetite Framework (RAF) for the IOR and reinforcing the risk-sensitive approach and the Catholic investment criteria in the investment process as to strengthen the quality of its products; 9. Addressing legacy issues to which IOR is exposed in coordination with the Vatican regulator and judicial authorities. Significant efforts were also made to allow the IOR to be FATCA compliant and, in addition, in October, the Agreement between the Government of the Republic of Italy and the Holy See on tax matters became effective. Both of these events represented a major milestone for the IOR and are a very important step in all the efforts made to bring full transparency in the operations of the IOR. The Board, after meeting with the Revisori and the external auditors, approved the Institute’s accounts and the management report for 2016, ensuring compliance with applicable requirements and new recommendations introduced by the AIF. The net result for 2016 is Euro 36 million. This results - whose details are provided in “Financial Statement” Section - reflects the continuous down trend of interest rate in Europe and the conservative approach that the Institute has adopted on managing its assets since 2014. As described in Management Report, Section 2, Part 1 - 2016 Business Review, this was achieved in a year of complex financial and political evolutions. In the meeting of the Board of Superintendence on 26 April 2017, attended by both the members of the Revisori and the external auditors, the financial statements for 2016 and the proposed distribution of profits to be made to the Holy See for 2016 were discussed and approved. As per the Statutes these informations were provided to the Commission of Cardinals to enable them to decide on the allocation of profits. The financial statements, prepared in accordance with IFRS, as adopted by the Circular issued by the AIF, have been audited by Deloitte & Touche S.p.A. 2017 and beyond All the efforts lead by the Board since 2014 will continue in 2017. Improving client experience at IOR, working towards full compliance with AIF regulations, continuing its commitment to AntiMoney laundering, working on the evolution of certain aspects of the IOR’s business model, developing IOR’ approach to faith investing, furthering the work on governance, and consolidating the role of the control functions will represent the Board’s main objectives. Acknowledgements I would like to thank all the Board members for their support, their contribution and their dedication. Many of them have devoted a considerable amount of their time to help guide the IOR through this year of transition and change. In 2016, the Board has continued to strive towards building a close working relationship with the Commission of Cardinals. I wish to extend my gratitude to the president and all the members for their availability and support. I also wish to express my appreciation for the work of Gian Franco Mammì, the Director General, the Prelate Mgr. Ricca and to all employees of the IOR. The work performed by the members of the Revisori and the external auditors have also been critical to the progress made by the IOR. IOR Annual report 2016 13 2. MISSION, CUSTOMERS AND SERVICES Mission of the Institute The Istituto per le Opere di Religione (the “Institute” or “IOR”) is an institution of the Holy See, founded on 27 June 1942 by Chirograph of His Holiness Pius XII. Its origins date back to the “Commissione ad Pias Causas” established by Pope Leo XIII in 1887. The mission of the IOR, established by its Statute, with reference to the Chirograph dated 1 March 1990 of His Holiness John Paul II, is “to provide for the custody and administration of goods transferred or entrusted to the Institute by natural or legal persons, designated for religious works or charity. The Institute can accept deposits of assets from entities or persons of the Holy See and of the Vatican City State”. The IOR strives to serve the global mission of the Catholic Church through the administration of the entrusted assets and providing payment services to the Holy See and related entities, religious orders, other Catholic institutions, clergy, employees of the Holy See and the accredited diplomatic bodies. The IOR is exclusively located on the sovereign territory of the Vatican City State and subject to the regulations and legislation applicable therein. The IOR is supervised and regulated by the “Autorità di Informazione Finanziaria” (AIF). Customers of the IOR Customers served by the Institute include: a) Institutional counterparties (Sovereign Institutions of the Holy See and Vatican City State and related entities, nunciatures and apostolic delegations, embassies and diplomats accredited to the Holy See); b) Non-institutional counterparties (Institutes of Consecrated Life and Societies of Apostolic Life, Dioceses and other Vatican legal canonical or civil entities as legal persons; clerics and members of Institutes of Consecrated Life and Societies of Apostolic Life, employees and retirees of the Vatican as natural persons). Most of the IOR’s clients are active in missions or perform charitable works at institutions such as schools, hospitals or refugee camps. The Catholic Church, through its institutions involved in missionary activities and charitable works, is present throughout the world, even in countries with very basic infrastructure and underdeveloped banking and payment systems. In such cases, the IOR’s services are particularly valuable. For customers located in these areas, the IOR is a bedrock, affirming itself as a trusted institution able to provide on-site services otherwise lacking or absent. This is even more evident in those geographic areas with high political financial instability. Nature of the Institute’s services On behalf of its clients, the Institute carries out financial activities authorized by the AIF, and offers the following services: acceptance of deposits, asset management, certain custodial functions, international payment transfers through correspondent banks, and holding salary and pension accounts of employees of the Holy See and the Vatican City State. IOR Annual report 2016 14 The Institute protects its clients’ assets by primarily investing in financial instruments characterized as very low risk (e.g. government bonds, bonds issued by institutions and international organizations, as well as deposits in the interbank market). Credit activity is residual and strictly subject to constraints of the internal policies as established by the Board of Superintendence. The IOR does not issue, underwrite or place securities. Accounts opened at the IOR by authorized customers meet the requirements of the legislation on preventing and combating money-laundering and the financing of terrorism in force in the Vatican City State. Customers are provided with services in IOR offices located in the Vatican City State. The IOR has no other locations. 3. CORPORATE GOVERNANCE The IOR’s governance structure is defined in its current Statutes. It consists of five bodies: Commission of Cardinals, Prelate, Board of Superintendence, Directorate and the Revisori. The Commission of Cardinals oversees the Institute’s adherence to its Statute. It appoints and removes members of the Board of Superintendence. Furthermore: – It deliberates, after considering the financial statements and taking into account IOR’s own financing needs, the distribution of profits; – It proposes to the High Authority changes to the Statute; – It deliberates the compensation due to members of the Board of Superintendence; – It approves the appointment and removal of the Director General and of the Vice-Director made by the Board of Superintendence; – Resolution of any issues concerning the members of the Board of Superintendence and the Directorate. IOR Annual report 2016 Members of the Commission of Cardinals are appointed for a five year term, and can be reappointed. The current members are: Cardinal Josip Bozanic Archbishop of Zagabria Cardinal Santos Abril y Castello President Archpriest of the Papal Basilica of St Mary Major Cardinal Christoph Schönborn Archbishop of Vienna Cardinal Pietro Parolin Secretary of State Cardinal Thomas Christopher Collins Archbishop of Toronto Cardinal Jean-Louis Tauran President of the Pontifical Council for Interreligious Dialoue 15 IOR Annual report 2016 16 The Prelate is appointed by the Commission of Cardinals. The Prelate: – Oversees the activities of the Institute and may have access to its acts and documents; – Participates, as Secretary, in meetings of the Commission of Cardinals, drafting the minutes of the meeting; – Attends the meetings of the Board of Superintendence; – Submits his comments to the Commission of Cardinals, notifying the Board of Superintendence. Msgr. Battista Mario Salvatore Ricca was appointed as the Prelate of the Institute in June 2013. The Board of Superintendence is responsible for the administration and management of the Institute, as well as the oversight and supervision of its financial, economic and operational activities. In particular, the Board has the task of: – Formulating general policy guidelines and basic strategies for the activities of the Institute in line with its mission; – Defining the criteria for the implementation of annual programs and objectives of the Directorate, and approving its proposals; – Verifying the economic-financial activities of the Institute; – Monitoring compliance with established programs and objectives, with regard to investments and other activities; – Defining the most appropriate financial structure for the Institute, proposing the ways to improve it, and in general, the best means to increase its assets and activities in the context of correct adherence to economic-financial rules and in full compliance with the overall mission of the Institute; – Proposing to the Commission of Cardinals changes to the Statutes as long as they are unanimously approved by the Board of Superintendence; – Arranging for the issuance of the Institute’s Regulations, which are required to provide a detailed description of the powers and competencies of the Board and of the Directorate; – Delegating signing power in the name of the Institute to the Director General and, at their request, the Vice-Director, Managers and Officers, in the manner prescribed in the Regulations; – Approving the Financial Statements prepared by the Directorate. The members of the Board of Superintendence are nominated by the Commission of Cardinals and serve for a five year term, and can be reappointed. The Board consists of 7 members. IOR Annual report 2016 Jean-Baptiste de Franssu Mary Ann Glendon President Michael Hintze Mauricio Larrain Georg Freiherr von Boeselager (since December 2016) Scott C. Malpass (since December 2016) Javier Martin Romano (since December 2016) 17 IOR Annual report 2016 18 The Board of Superintendence fully performed its duties as defined by law and applicable procedures. It continued to advise and supervise the Directorate in rolling out the agreed reform plan and provided support for strategically important issues relating to the future development of the IOR. In December 2016, 3 new members were appointed to the Board following notably the resignations of Dr. Carlo Salvatori and Dr. Clemens Boersig. The Board wishes to express its gratitude to Carlo Salvatori and Clemens Boersig for all the help and counsel they provided to the IOR during their tenure. The 3 new members, formally appointed on December 15, 2016, are Georg Freiherr von Boeselager, Scott Malpass and Javier Marin Romano. In 2016, the Board of Superintendence convened for six meetings and dealt with the strategic and operating development of the IOR. All members participated in the meetings of the Board of Superintendence and the committees to which they belong to for the year under review. The Board continued its work on strengthening IOR standards of corporate governance.The meetings of the Board of Superintendence continued to represent an open exchange of information and ideas to find the appropriate resolutions to meet the needs of this unique institution. During these meetings, the Board benefitted from each member’s specific expertise in various subject matters, and the Board also held regular executive sessions to discuss specific topics in-depth. Once approved, the minutes of all Board meetings were shared with the Revisori, the Directorate, the Prelate and the Commission of Cardinals. During the year, the Board passed resolutions on a number of matters after careful analysis and consultation, and in close coordination with the Directorate and the Commission of Cardinals, for which the Board’s consent was mandatory. In 2015, the Board created two Board committees to strengthen the Governance of the Institute and the Board’s work, although such committees were not yet provided for by the Statute. An Audit & Risk and HR & Remuneration committees were first established. In 2016, the Board created a Past Abuses Committee to help and support the Board in its work of understanding and concluding the investigation of legacy issues to which IOR was exposed. The Committee completed its work at the end of January 2017, which included a thorough review of all cases and issued a detailed set of recommended legal actions. The results of this work has been filed with Vatican Regulator and Vatican Judicial Authorities. Minutes were drafted for each committee meeting and distributed to all Board members, along with a specific report presented by the respective presidents of those committees at each Board meeting and an annual report at year end. a) Members of the Human Resources and Remuneration Committee Mary Ann Glendon – Chair Carlo Salvatori (until May 2016) Jean-Baptiste de Franssu (ex officio) Mauricio Larrain In attendance: Mario Busso, President of Revisori b) Members of the Audit and Risk Committee Sir Michael Hintze – Chair Leslie Ferrar (non-board member) Clemens Boersig (until May 2016) Jean-Baptiste de Franssu (ex officio) Wiet Pot (non-board member) In attendance: Mario Busso, President of Revisori IOR Annual report 2016 19 c) Members of the Past Abuse Committee (June 2016 – January 2017) Jean-Baptiste de Franssu - Chair Sir Michael Hintze In attendance: Giovanni Barbara, Member of Revisori A focus was made in 2016 on the development of appropriate control functions, reinforcing their independence and ensuring that activities and controls were properly carried out. Today, they are comprised of: – Internal Audit – Risk management and Compliance In accordance with law no. XVIII/2013 (see art. 27 et seq.) and best international practices, the Internal Audit function reports to the Board with a dotted line to the Directorate. In terms of second-level controls, Risk management and Compliance department is directly responsible, among other things, for the AML/CFT (Anti Money Laundering/Combating the Financing of Terrorism) activities. The Revisori and the External Auditors have regularly and thoroughly carried out their activities during 2016, as expected. IOR Annual report 2016 The Directorate is responsible for all operational activities of the Institute and is accountable to the Board of Superintendence. The Directorate is appointed by the Board of Superintendence and approved by the Commission of Cardinals and consists of: The Revisori must: – Verify at least quarterly, the administrative and accounting review of the Institute’s books and records; – If requested by the Board of Superintendence, the Revisori may conduct internal audits or other inspections; – Review the financial statements including the report of the Directorate and supporting documents, provide written comments to the Board of Superintendence and present their observations to the attention of the Directorate and the Prelate. The Revisori consists of three members, appointed by the Board of Superintendence for a maximum period of three years. They can be reappointed. Current members are: – Mario M. Busso, President of the Revisori – Giovanni Barbara – Luca Del Pico Giulio Mattietti “Aggiunto al Direttore” with delegated functions Gian Franco Mammì Director General 20 IOR Annual report 2016 21 4. IOR ORGANIZATION CHART 5. REGULATORY FRAMEWORK AND TAX REQUIREMENTS Regulatory framework The Institute is subject to the laws and regulations of the Holy See and Vatican City State. The Vatican legal framework recognizes the Canon Law as the primary source of legislation and the primary criterion for its interpretation. Furthermore, there are six organic laws and other ordinary laws specific to the Vatican City State. For matters not covered by Vatican laws, laws and other regulations issued by the Italian Republic are observed as supplementary, subject to prior approval by the competent Vatican authority.They are adopted on the condition that they do not conflict with the doctrine of divine law, the general principles of Canon Law or the provisions of the Lateran Pact and subsequent Agreements, and provided that they are applicable to the state of affairs existing in Vatican City (See law No LXXI on the source of law, promulgated by Pope Benedict XVI on 1 October 2008). According to article 1.4 of Law no. LXXI on the sources of law, the legal framework must also conform to the general norms of international law, and to those arising from treaties and other agreements to which the Holy See is part of. The Institute is subject to Law no. XVIII of 8 October 2013 that covers norms of transparency, supervision, and financial intelligence and, as an entity that carries out financial activities on a professional basis in Vatican City State, it is also subject to Regulation No. 1 “Prudential Supervision of Entities carrying out financial activities on a professional basis” issued by AIF and enacted on 13 January 2015. The Regulation No. 1, establishing a clear system of authorization, stipulates the criteria for the organization and management of entities and mechanisms of internal control. IOR Annual report 2016 DIPARTIMENTO BILANCIO DIPARTIMENTO IT E SICUREZZA DIPARTIMENTO OPERATIONS DIPARTIMENTO FINANZA DIPARTIMENTO GESTIONI PATRIMONIALI DIPARTIMENTO RAPPORTI CON LA CLIENTELA COMMISSIONE CARDINALIZIA PRELATO RISK MANAGEMENT E COMPLIANCE SEGRETERIA DI PRESIDENZA LEGALE INTERNAL AUDIT RISK MANAGEMENT COMPLIANCE ED ANTIRICICLAGGIO CONSIGLIO DI SOVRINTENDENZA DIREZIONE SEGRETERIA DI DIREZIONE SEGRETERIA AMMINISTRATIVA ORGANIZZAZIONE E RISORSE UMANE DIPENDENZA FUNZIONALE DIPENDENZA GERARCHICA DIPENDENZA AMMINISTRATIVA On 15 December 2016, the AIF promulgated the “Circular relating to the preparation of the annual financial statements and the consolidated financial statements of entities carrying out financial activities on a professional basis”. These financial statements have been prepared in accordance with the aforementioned Circular. Tax requirements On 15 October 2016 the “Agreement between the Government of the Italian Republic and the Holy See in tax matters” became effective. The Agreement had also a two-fold impact on the Institute’s activities. In fact, the agreement provides for clients resident in Italy for tax purposes, on one hand, the regularization of the client positions in the prior years from 2010 to 2015 and, on the other hand, henceforth, that clients fulfill their tax debts through a Fiscal Representative chosen by the Institute. Concerning previous years it has been provided by a specific implementing act of the Secretary of State that the IOR assist its clients in compiling the instance with reference to the data regarding the investments held at the Institute and the calculation of taxes due, in addition to all the related administrative tasks. For the current and future period, the IOR must provide the calculations and withhold taxes to customers which will be paid to the Italian Government via an Italian tax representative. This required significant efforts to be made prior to the affectiveness of the agreement and in the following months. A specifictask force was established at the Institute to provide assistance to clients with the calculation of the amounts due and related administrative activities. Effective 2015, the IOR is subject also to the Foreign Account Tax Compliance Act (FATCA), a United States federal law that requires U.S. persons, including individuals who live outside the United States, to report their financial accounts held outside of the United States to the U.S. Internal Revenue Service (IRS). FATCA also requires foreign financial institutions to report to the IRS the accounts of their U.S. clients. In this context, the Holy See has reached an Intergovernmental agreement (IGA) with the United States signed in June 2015. Under the terms of the IGA, the Holy See is a jurisdiction treated by the US Authorities as if the IGA was effective as of 30 November 2014, and the IOR has been assigned an identification code (GIIN) by the IRS. The IOR fully complies with the terms of the IGA. 6. PROPOSAL OF DISTRIBUTION OF THE NET PROFIT FOR THE YEAR For the net profit for the year ended 31 December 2016 amounting to EUR 36.0m, the Board of Superintendence intends to propose to the Commission of Cardinals, that the profits be distributed in full without making any provision to the Reserves, also considering the adequacy of capital (for further details see Part 6 - paragraph 6.2.2 “Capital adequacy”). 22 IOR Annual report 2016 CHAPTER 2 OPERATIONAL INFORMATION 1. 2016 BUSINESS REVIEW Macroeconomic environment Below is an overview of the macroeconomic environment that characterized 2016, with particular reference to those markets and events that had the strongest influence on the performance of the Institute’s portfolio. In 2016, financial market trends were characterized by the sharp increase in uncertainty and there were also several factors that increased risk aversion. In the first few weeks of the year, fears of a slowdown in advanced economies intensified, first and foremost in the US economy, in addition to fears of a contraction in the Chinese economy.The expectations of a new economic crisis that could have a domino effect to all the international markets therefore increased. Concerns over China also affected the market for raw materials and oil prices dropped to the lowest level of the year. This turbulent start was followed by a mild recovery that lasted until the major electoral appointments of the year, the British Brexit referendum, the US elections and the Italian constitutional referendum. Although the outcomes were not what financial operators had hoped for, the markets proved to be unexpectedly resilient. In the UK, the outcome of the referendum to decide on whether or not to remain in the European Union resulted in a sharp devaluation of the Pound and led to the adoption of expansionary monetary measures. In the United States, the “shock” of Trump’s victory was instead short-lived. His victory was viewed as a turning point attributed to announcements of implementation of fiscal stimulus measures, tax cuts and a corporate law reform, fuelling expectations of higher inflation. In Italy, while the victory of the “No” vote on the constitutional reform last December led to Prime Minister Renzi’s resignation, it did not result in the feared meltdown on Italian government bonds. At the macroeconomic level, 2016 was a year of modest growth for both Europe and the United States, with contrasting trends during the year. US economic growth was lower than expected in the first half. Indicators improved half way through the year, signalling the possibility of an increase in manufacturing activity towards the end of the year. However, 2016 ended with a slowdown in economic growth at 1.9% in the fourth quarter, although employment rates and incomes continued to grow. In the Eurozone, there were conflicting economic indicators. Quarterly GDP growth slowed during the April – June period, but the annual change remained sufficient to promote a grad- 23 IOR Annual report 2016 Gian Franco Mammì Director General Istituto per le Opere di Religione ual improvement in the labor market with a steady absorption of the unemployment rate, which still remains high. Inflation gradually increased towards the end of the year due to the rise in energy prices. Central Bank Monetary Policies continued to be expansionary in many countries over the year. In March, the ECB cut interest rates, introduced new monetary stimulus measures extending, at least until the end of 2017, the government bond purchase program in order to jump start economic growth. By contrast, in the wake of the economic improvement, the US Federal Reserve decided to raise interest rates by 25 basis points in December, widely expected by the market. The bond markets reacted positively for most of the year. The ECB’s measures, combined with low inflation, have lowered yields on government securities in all sectors, with the yield on German tenyear bonds becoming negative. Italian government securities also benefited from the ECB’s purchase program that helped keepTreasury bond yields low (10-yearTreasury bond yield was 1.25% in midyear, after having peaked at 1.7% in February) and limited the spread on German bond yields during turbulent market phases.Towards the end of the year, US, Japanese and EuropeanTreasury bond yields rose significantly, resulting in a significant reversal of the bond curve as a result of a change in the expectations of rising interest rates and expansionary fiscal policies aimed to counter weak economic growth. Bond rates remained very low but with the risk of an increase. During 2016 the stock market was severely affected by political events, with European stocks showing lower yield trends compared to the US given the concerns about a possible disruption in the European political scenario, also as a result of the UK referendum.The first nine months of 2016 were characterized by pronounced volatility and heightened risk aversion among investors in the main international markets, particularly, in the Eurozone and Asia. In June, the unexpected victory of the “Leave” campaign in the Brexit referendum brought about a sharp downward adjustment in share prices and a new increase in investors’ risk aversion (share prices in Italy experienced a sharp decline with a mid-year high of -25%, with twice that on the Italian banking sector index) before recovering towards the end of the year thanks to the improvement in the US economy, the continued flow of liquidity provided by monetary policies and the expectations of procyclical fiscal policies. Currencies were at the forefront of news reports in 2016, particularly in the UK following the outcome of the referendum: in fact, the Pound immediately fell 10% against the dollar to close the year at -16%. The Euro declined against the dollar, due to the increasing marked divergence in terms of monetary policy. Overall, 2016 was another very positive year for the US dollar, against which the Euro and the Swiss Franc, in addition to the Pound, lost value. Instead, the Japanese Yen held its ground. Lastly, with regards to raw materials, we experienced fluctuations in the prices of gold and oil. After almost two years of decrease in the prior of oil, the major commodity indices seems to have stabilized, going from 26 dollars per barrel in January 2016 to 50 dollars towards the end of year, in part to the agreement reached by OPEC. Gold, as the main safe haven asset in times of high risk aversion, peaked in the first half of 2016, having risen from its lowest price at 1061$/oz in December up to 1370$/oz in July. In the second half of the year, except for the short-lived surge that followed the election of Donald Trump, gold prices suffered to the point of reaching its lowest price in 10 months: 1,122.35$/oz, mainly because of the FED’s announcement of an increase in interest rates and the expectation of another three increases in 2017. Composition of the Client base At the end of 2016, the IOR had 14,960 clients (2015: 14,801), of which the vast majority, measured by assets entrusted to the Institute, were legal persons under Canon Law.The IOR’s customers have a common characteristic, which is that they are part of and serve the Catholic Church (seeclient definition in Chapter 1). 24 IOR Annual report 2016 IOR Annual report 2016 25 Measured by assets entrusted, the most important group of clients, was religious orders. They accounted for more than half of our client base in 2016 (54%), followed by Roman Curia departments, Holy See Offices and nunciatures (11%), entities of Canon Law (9%), cardinals, bishops and clergy (8%), episcopal conferences, dioceses and parishes (8%), with the remainder split between various others, such as Vatican employees and pensioners and Canon Law foundations. In addition to depositing funds with us, we manage our clients’ portfolios of assets on their behalf or act as custodians. As of 31 December 2016, the net value of assets held in managed portfolios was EUR 3.1bn (2015: EUR 3.2bn), the net value of assets held in non-managed portfolios was EUR 554.8m (2015: EUR 646.2m) and the value ofcustomer deposits was EUR 2.0bn (2015: EUR 1.9bn), resulting in EUR 5.7bn in total client assets (2015: EUR 5.8bn). (in thousand Euro) 2016 2015 In Balance Off Balance Total In Balance Off Balance Total Sheet Sheet Sheet Sheet Customer deposits (including Legates) 2,028,973 2,028,973 1,946,854 1,946,854 Assets under Custody 554,763 554,763 646,161 646,161 Assets under Management 410,563 * 2,700,366 3,110,929 424,815 2,760,870 3,185,685 Total 2,439,536 3,255,129 5,694,665 2,371,669 3,407,031 5,778,700 *Deposits of Assets Management are net of commissions collected in the first days of 2017. Assets under Custody mainly include client-owned securities held at the IOR for custodial purposes. The clients make all investment decisions and the IOR has no discretionary power to manage these assets, provided that such decisions are in accordance with the role and mission of the Institute. For the purpose of table above, securities, gold and precious metals under custody are stated at market values. Assets under Management consist mainly of client-owned securities held at the IOR for management purposes. Investment decisions are made by the IOR on the basis of portfolio management mandates signed with its clients. For the purpose of table above, securities under management are stated at market values. Income Statement In 2016, IOR’s Net profit was EUR 36.0m (2015: EUR 16.1m).Theincreasefrom 2015 was mainly due to improved results from Net Income for trading activities, to the remeasurement of a provision for tax remediation to foreign countries recognized in 2015 and to the decrease in Administrative expenses.The results were partially offset by the decrease in Interest Margin and Net fee and commission income. A brief overview of the main components of the Income Statement is presented below. The most significant source of revenues is the profit derived from Treasury activities on proprietary portfolios. The most important component was derived from bond yield which contributed for EUR 39.6 million (interests EUR 38,0 million plus trading results EUR 1.6 milion). Interest Margin amounting to EUR 36.7m decreased by 16% compared to EUR 43.6m in 2015. This was mainly affected by the decline in the yield on investments in securities and bank deposits and a decline in interest paid to customers, although the average amounts of capital invested re- IOR Annual report 2016 26 mained unchanged at EUR 2.9bn (2015: EUR 2.9bn); The average rate on customer deposits declined to 0.11% in 2016 from 0.22% in 2015, while the average yield on investments in securities and bank deposits declined to 1.35% in 2016 from 1.64% in 2015. Accordingly, the spread between the average rate received on assets and the average rate paid on liabilities decreased to 1.24% from 1.42%.This was mainly due to the expiration of securities in 2016 purchased in previous years with a nominal interest rate higher than those currently available on market. Net Income for trading activities recognised a net loss of EUR 9.0m compared to a net loss of EUR 15.4m in 2015. The result was mainly affected by the decrease in UCI unit investment compared to 2015, amounting to EUR -12.8 milion. The improvement in the results was mainly due to the positive performance of the bonds held in the proprietary portfolio in 2016, compared to 2015, to market trends during the year. More specifically, debt securities recognised a positive total net profit, including gains and losses from trading and gains and losses from valuation, amounting to EUR 1.6m in 2016 compared to a loss of EUR 17.1m in 2015. Equity securities recorded a profit of EUR 94,000 in 2016, versus a loss of EUR 307,000 in 2015, while FX activity contributed for EUR 2.0 million versus EUR 1.9 million in 2015. The value of UCI unit investment decreased by 2015 due to the write-down of an investment fund held in the portfolio in addition to other losses for a total of EUR 12.8 million in 2016 versus EUR 149.000 in 2015. Dividends increased by 7.8% to EUR 2.1m from EUR 2.0m in 2015. Net Fee and Commission income decreased 15.9% to EUR 12.8m in 2016 from EUR 15.2m in 2015. Fee and Commission Income decreased 10.6% to EUR 15.8m in 2016, from EUR 17.7m in 2015, while Fee and Commission Expense rose to EUR 3.0m in 2016 from EUR 2.5m in 2015 (+22.1%). The most important component of the Fee and Commission Income was commissions from Asset Management services, which decreased 8.7% to EUR 12.5m in 2016 from EUR 13.7m in 2015. This was mainly due to the shift of some customers to asset management lines, mainly composed by bond securities, with lower commissions than lines composed mainly by equity securities, that the same clients owned before. The increase in Fee and Commission Expense was mainly due to the fees paid for bank deposits (EUR 571,000 in 2016), paid for the first time in 2016, and to the increase in commission paid for custody and administration of securities, amounting to EUR 1.6m in 2016 from EUR 0.9m in 2015. This is partially offset by the decrease in commission paid for trading in financial instruments, which decreased to EUR 83,000 in 2016, from EUR 648,000 in 2015, due to the fact that, starting from 2016, clients directly pay commissions on securities transactions whereas previously, they were paid by the Institute and collected later. Administrative Expenses were EUR 19.1m in 2016 (2015: EUR 23.4m). This includes Staff Expenses of EUR 10.2m in 2016, in reduction with the prior year amount (2015: EUR 11.3m, or - 9.1%). As of December 31, 2016, the IOR had a total of 102 personnel (2015: 109). During the year, six employees retired and one resigned. Administrative expenses also include expenses for professional services, which decreased from EUR 7.6m in 2015 to EUR 4.0m in 2016.This was due to lower extraordinary costs incurred during the year from the completion of certain projects. IOR Annual report 2016 27 Other administrative expenses slightly increased by 7.2% to EUR 4.9m in 2016 from EUR 4.6m in 2015 due to higher costs incurred for maintenance. Net provisions to risks and charges in 2016 amounted to a profit of EUR 13.0m (2015: loss of EUR 16.5m) due to the reestimation of a tax provision for exposure in foreign countries recorded in 2015. Other Operating Income (Expense) recognised income of EUR 7,000 (2015: income of EUR 10.5m); the difference, compaired to the previous year, is mainly due to EUR 13.6m of extraordinary income recorded in 2015 related to the closing of an issue from prior years. Balance Sheet As of 31 December 2016, total assets on the IOR’s balance sheet was EUR 3.3bn (2015: EUR 3.2bn), with equity of EUR 672.6m (2015: EUR 670.3m). On the Liabilities side, Due to customers is the most significant line item, representing 92.4% of total liabilities. The balance slightly increased from the prior year, amounting to EUR 2.4bn (+3.3%). Customer deposits increased by EUR 75.5m, while asset management liquidity decreased by EUR 14.3m. Our clients expect a conservative approach in financial management by the IOR, with investments in liquid securities and high quality credit risk. Investments in the stock market and similar financial instruments are relatively limited and based on companies with strong fundamentals which generally tend to pay high dividends. No funding activities are carried out on the interbank market and IOR does not issue debt securities. As previously reported in Chapter 1, credit activity is residual and strictly subject to constraints of the internal policies as established by the Board of Superintendence. The asset side of the balance sheet mainly reflects bank deposits and securities, and less than 3% of total assets is held in UCI units and equities. Bank Deposits totaled EUR 643.2m at the end of 2016 (2015: EUR 644.1m). These mainly consisted of EUR 457.6m in deposits on demand (2015: EUR 265.4m), and EUR 108.5m in term deposits in the interbank lending market (2015: EUR 292.5m). The remaining part, EUR 77.1m (2015: EUR 60.7) concerned term deposits with APSA. The value of IOR Securities (debt securities, equity securities and investment funds) was EUR 2.5bn in 2016 (2015: EUR 2.3bn). Bonds, at EUR 2.4bn, were the most significant investments, representing 96.3% of the securities held as of 31 December 2016, while equities accounted for 2.4%, and investment funds for 1.3%. As previously explained, the volume of the securities in the portfolio slightly increased compared to 2015, while the portfolio composition remained unchanged. Profitability ratios The table below highlights the main economical, financial and productivity ratios: Profitability ratios (%) 2016 2015 ROE (Returns on Equity) 5.66% 2.47% ROA (Returns on Assets) 1.10% 0.50% Operating costs / Earnings margin 15.52% 66.05% Interest margin / Earnings margin 83.15% 96.03% Net fee and commission income / Earnings margin 29.05% 33.51% Interest margin / Total Assets 1.12% 1.36% Earnings margin / Total Assets 1.35% 1.42% The ratios ROE and ROA recorded an increase compared with the previous year due to the increase in Net profit. The profitability, explained from the ratio “interest margin / total assets”, amounted in 2016 to 1.12% against 1.36% recorded in 2015, due to the reduction of interest margin; the ratio “earnings margin / total assets” recorded almost a result in line with the previous year (1.35% in 2016, 1.42% in 2015). These two ratios showed that the Institute ability to create income slightly decreased, but the negative effects were balanced by the decrease of operating costs, showing good flexibility in reacting promptly to market changes. Other aspects The IOR does not issue securities, neither underwrite or place securities; it protects its client assets by primarily investing in financial instruments characterized as very low risk (e.g. government bonds, bonds issued by institutions and international organizations, as well as deposits in the interbank market). The IOR has no branches and provide services only at the IOR office located in the Vatican City State. The Institute owns 100% of the real estate company SGIR S.r.l., with registered office in Italy. The Institute has a long-term zero-interest loan to its subsidiary SGIR S.r.l., amounting to EUR 3.3m. During 2015, the Institute signed a loan agreement for the use of 4 real estate properties at no cost with its subsidiary SGRI S.r.l. During 2016, SGIR S.r.l. did not earn rental income on these properties. 2. FORECAST FOR 2017 In the first months of 2017, the Institute’s activity was in line with the Strategic Plan approved by the Board of Superintendence in January 2017.The main objective is to improve the quality of services offered to clients. The forecast for 2017 is a stable base of customer deposits, a result of a balance between the outflows due to the tax agreements signed between the Holy See and other countries and inflows due to the increased quality of services offered. By the end of 2018, the results of this work should be apparent. The effort, already undertaken in recent years, to comply with Holy See laws and regulations and international best practice will continue to be implemented.The same will apply with international tax matters. 28 IOR Annual report 2016 The issues of transparency and reputation will obviously be the core in this process of growth; many steps and activities have been taken from 2013 to make the Institute more transparent and aligned with international best practices. The IOR will continue to operate in accordance with his Mission that is to serve the Holy Father with prudence, in His mission as the Universal Pastor, through the provision of dedicated financial advisory, in complete compliance with Vatican and international laws in force and with what the Holy Father said “the main goal of the IOR cannot be to have the maximum possible gain, but should be goals that are compatible with the norms of morality, consistent efficiency and practices respecting the specificity of its nature and exemplarity in its mode of operation”. 29 IOR Annual report 2016 FINANCIAL STATEMENTS IOR Annual report 2016 33 BALANCE SHEET IOR financial statements for 2016 are prepared in accordance with the Circular concerning the annual financial statements and the consolidated financial statements of entities carrying out financial activities on a professional basis, issued by Authority of Financial Information on 15 December 2016. The 2015 figures have been reclassified according to the provisions of the Circular above mentioned. (in Euro) ASSETS 2016 2015 10. Cash and cash equivalents 50,850,340 114,737,182 20. Financial assets held for trading 1,918,104,346 1,667,965,933 40. Financial assets available for sale 6,664,406 15,167,415 50. Financial assets held to maturity 558,955,610 614,818,290 60. Due from banks 643,229,012 644,089,443 70. Due from customers 29,152,785 86,233,851 100. Investment in subsidiaries 15,834,950 15,834,950 110. Tangible assets 3,095,565 2,981,724 120. Intangible assets 1,043,850 874,809 150. Other assets 41,958,806 41,556,606 Total Assets 3,268,889,670 3,204,260,203 LIABILITIES AND EQUITY 2016 2015 10. Due to banks 10,597,312 20. Due to customers 2,398,924,457 2,323,402,903 100. Legates 47,074,644 48,266,303 110. Other liabilities 18,709,825 20,086,868 120. Staff severance fund 6,992,585 6,788,489 130. Provision for risks and charges 124,588,179 124,838,475 (a) Provisions for pensions and similar obligations 121,088,179 108,338,475 (b) Other provisions 3,500,000 16,500,000 140. Valuation reserves (45,534,851) (27,981,254) 160. Reserves 382,134,172 382,134,172 (a) Unavailable reserves 100,000,000 100,000,000 (b) Available reserves 282,134,172 282,134,172 170. Capital 300,000,000 300,000,000 180. Net profit for the year 36,000,659 16,126,935 Total Liabilities and Equity 3,268,889,670 3,204,260,203 34 IOR Annual report 2016 INCOME STATEMENT (in Euro) INCOME STATEMENT 2016 2015 10. Interest and similar income 39,831,730 48,640,984 20. Interest and similar expense (3,168,836) (5,002,810) 30. Interest margin 36,662,894 43,638,174 40. Fee and commission income 15,836,850 17,709,979 50. Fee and commission expense (3,029,222) (2,481,584) 60. Net fee and commission income 12,807,628 15,228,394 70. Dividends and similar income 2,107,013 1,954,367 80. Net income for trading activities (8,982,924) (15,377,567) 100. Profit (loss) on disposal or repurchase of: 1,499,109 (b) Financial assets available for sale 1,499,109 120. Intermediation margin 44,093,720 45,443,368 130. Net losses/reversal on impairment: (1,331,864) 197,034 (a) Receivables (1,045,306) 352,909 (b) Financial assets available for sale (148,314) (d) Other financial operations (138,244) (155,875) 140. Net income from financial operations 42,761,856 45,640,402 150. Administrative expenses: (19,085,562) (23,427,846) (a) Staff expenses (10,244,959) (11,268,224) (b) Professional services expenses (3,961,573) (7,607,374) (c) Other administrative expenses (4,879,030) (4,552,248) 160. Net provisions to risks and charges 13,000,000 (16,500,000) 170. Net value adjustments to/recoveries on tangible assets (82,789) (63,868) 180. Net value adjustments to/recoveries on intangible assets (682,777) (511,793) 190. Other operating income (expense) 7,287 10,489,260 200. Operating costs (6,843,841) (30,014,247) 220. Net result of fair value valuation of tangible and intangible assets 82,644 500,780 250. Profit (loss) from current operations before taxes 36,000,659 16,126,935 270. Profit (loss) from current operations after taxes 36,000,659 16,126,935 290. Profit (loss) for the year 36,000,659 16,126,935 IOR Annual report 2016 35 STATEMENT OF COMPREHENSIVE INCOME (in Euro) 2016 2015 10. Profit (loss) for the year 36,000,659 16,126,935 Items that will not be reclassified to Income Statement 40. Defined benefit plans (13,275,014) 8,880,551 Items that are or may be reclassified to Income Statement 100. Financial assets available for sale (4,278,583) 4,777,470 130. Total other income items (17,553,597) 13,658,021 Comprehensive income (item 10 + item 130) 18,447,062 29,784,956 STATEMENT OF CHANGES IN EQUITY (in Euro) 2016 Allocation of Changes during the year previous year profit Total net equity Changes in Total net equity Reserves Dividends Changes Extra Comprehensive Net at 31.12.2015 opening at 01.01.2016 and other in reserves dividend income Equity at balances allocations distribution 2016 31.12.2016 Capital 300,000,000 300,000,000 300,000,000 Reserves (a) unavailable 100,000,000 100,000,000 100,000,000 (b) available 282,134,172 282,134,172 282,134,172 (c) other Valuation reserves (27,981,254) (27,981,254) (17,553,597) (45,534,851) Net profit (loss) for the year 16,126,935 16,126,935 (16,126,935) 36,000,659 36,000,659 Net Equity 670,279,853 670,279,853 (16,126,935) 18,447,061 672,599,980 (in Euro) 2015 Allocation of Changes during the year previous year profit Total net equity Changes in Total net equity Reserves Dividends Changes Extra Comprehensive Net at 31.12.2014 opening at 01.01.2015 and other in reserves dividend income Equity at balances allocations distribution 2015 31.12.2015 Capital 300,000,000 300,000,000 300,000,000 Reserves (a) unavailable 100,000,000 100,000,000 100,000,000 (b) available 267,300,717 267,300,717 14,833,455 282,134,172 (c) other Valuation reserves (41,639,275) (41,639,275) 13,658,021 (27,981,254) Net profit (loss) for the year 69,333,455 69,333,455 (14,833,455) (54,500,000) 16,126,935 16,126,935 Net Equity 694,994,898 694,994,898 (54,500,000) 29,784,954 670,279,853 36 IOR Annual report 2016 CASH FLOW STATEMENT (in Euro) 2016 2015 A. Operating activities 1. Management 42,833,712 48,037,261 Interest income 48,639,880 55,060,588 Interest expense (3,168,341) (7,659,915) Dividends and similar income 2,107,013 1,954,367 Net commissions 12,807,628 15,228,394 Realised profit (loss) from trading activities 2,024,715 (6,521,066) Staff expenses (10,566,173) (10,043,861) Other administrative expenses (8,840,603) (13,323,635) Other income (expense) (170,407) 13,342,389 2. Cash generated by/used in financial assets (206,618,819) 68,576,005 Financial assets held for trading (266,429,528) 41,765,424 Financial assets available for sale 5,575,219 Due from banks: on demand (192,197,353) 17,854,851 Due from banks: other receivables 192,249,112 (48,714,530) Due from customers 54,408,236 61,305,128 Other assets (224,505) (3,634,868) 3. Cash generated by/used in financial liabilities 62,216,802 13,182,507 Due to banks: on demand (10,591,428) 10,581,312 Due to banks: other payables Due from customers 75,515,176 12,469,195 Outstanding securities Legates (1,191,659) Financial liabilities held for trading Financial liabilities carried at fair value Other liabilities (1,515,287) (9,868,000) Cash generated by/used in operating activities (101,568,305) 129,795,773 B. Investing activities 1. Cash generated by: 53,250,000 64,986,522 Disposals of investments in subsidiaries Dividends received on investments in subsidiaries Disposal/reimbursement of financial assets held to maturity 53,250,000 64,986,522 Disposals of tangible assets Disposals of intangible assets 2. Cash used in: (965,804) (34,206,681) Purchases of investments in subsidiaries Purchases of financial assets held to maturity (33,412,000) Purchases of tangible assets (113,986) (240,681) Purchases of intangible assets (851,818) (554,000) Cash generated by/used in investing activities 52,284,196 30,779,841 C. Financing activities Issues/purchases of capital instrument Dividend distribution and other purposes (16,126,935) (54,500,000) Cash generated by/used in financing activities (16,126,935) (54,500,000) Cash generated/used during the year (65,411,044) 106,075,614 IOR Annual report 2016 37 Items 2016 2015 Cash and cash equivalents at beginning of the period 114,737,182 16,351,306 Cash generated/used during the year (65,411,044) 106,075,614 Cash and cash equivalents: forex effect 1,524,202 (7,689,738) Cash and cash equivalents at end of the period 50,850,340 114,737,182 EXPLANATORY NOTES PART 1. ACCOUNTING POLICIES 1.1 GENERAL INFORMATION 1.1.1 Statement of compliance with accounting standards The 2016 financial statement have been prepared in accordance with the Circular concerning the annual financial statements and the consolidated financial statements of entities carrying out financial activities on a professional basis, issued by Authority of Financial Information on 15 December 2016. As stated in the Circular, the financial statements must be prepared in accordance with the “International Accounting Standards – IAS”, the “International Financial Reporting Standards – IFRS” and related Interpretations (“Interpretations SIC / IFRIC”), as adopted by the Vatican in a special arrangement to the Monetary Convention between the European Union and the State of the Vatican City on 17 December 2009. The 2015 figures have been reclassified according to the provisions of the above mentioned Circular. 1.1.2 Accounting policies The financial statements consist of the Balance Sheet, the Income Statement, the Statement of Comprehensive Income, the Cash Flow Statement, the Statement of Changes in Equity and the Explanatory Notes. Disclosures under IFRS 7 “Financial Instruments, disclosures” about the nature and extent of risks have been included in Part V “Information on Risks and Hedging Policies”. The accounting principles and valuation methods applied in the preparation of these financial statements, detailed below, are consistent with those of the previous financial year, except for new standards, new interpretations, or amendments of standards and except for gold, silver, medals and precious coins evaluation criteria. According to AIF Circular and IAS 2, starting from 1 January 2016, gold, silver, medals and precious coins are measured at the lower of cost and net estimated recoverable amount, as explained in the Section 1.1.4 “Other Aspects”. The financial statements of the Institute are prepared in Euro, while the explanatory notes are expressed in thousand Euro. For the various items, the 2016 figures and corresponding values for the previous year are provided. Where necessary, the comparative figures have been adjusted to conform to changes in presentations in the current year. The financial statements are prepared in Italian. The financial statements of the IOR were prepared on a going concern basis in accordance with IAS 1 “Presentation of Financial Statements”. As of the date of the approval of the financial statements, there were no material uncertainties and therefore no significant doubt regarding the Institute’s ability to continue as a going concern in the foreseeable future. 38 IOR Annual report 2016 The financial statements fairly present the financial position, financial performance and cash flows of the Institute. The preparation of the financial statements requires the Directorate to make certain estimates and assumptions about the future where actual results may differ. Estimates and assumptions affect the reported amounts of certain assets, liabilities, revenues and expenses in the financial statements. In addition, changes in assumptions may have a significant impact on the financial statements in the year in which the assumptions change. The preparation of the financial statements also requires the Directorate to exercise judgements in applying the IOR’s accounting policies to estimate the carrying value of assets and liabilities not readily obtainable from other sources. The Directorate believes that the underlying assumptions are appropriate and that the IOR’s financial statements fairly present its financial positions and results. All estimates are based on historical experience and/or expectations with regard to future events that seem reasonable on the basis of information known at the time of the estimate. They are also reassessed on a regular basis and the effects of any variation are immediately reflected in the financial statements. Those areas involving a higher degree of judgement or complexity, or areas where assumptions and estimates are significant to the financial statements, are disclosed in Section 1.1.4.1. “Critical accounting estimates and judgements”. The financial statements do not reflect a provision for taxes because there is no corporate income tax in Vatican City State. The Institute, given the immaterial value of its subsidiary, does not prepare consolidated financial statements in accordance with the provisions of the Conceptual Framework (QC6 – QC11) of IAS/IFRS, since the additional information coming from the consolidated financial statements would be of little relevance for the users of the financial statements. The Institute provides the additional information required by IFRS 12 “Disclosure of interests in other entities” in Part 5, Section 5.2.6 “Disclosure of unconsolidated structured entities for accounting purposes”. The financial statements of the Institute are prepared by the Directorate and approved by the Board of Superintendence, which will be submitted to the Commission of Cardinals. The Commission of Cardinals acknowledges the financial statements and decides on the distribution of profits, after taking into account the IOR’s own financing needs. 1.1.3 Subsequent events According the provisions of IAS 10, all events that took place subsequent to 31 December 2016 have been evaluated in the preparation of the 2016 Financial Statements. 1.1.4 Other aspects Starting from the financial year 2016 IOR applies the provisions arranged by the AIF Circular issued on 15 December 2016 about gold, silver, medals and precious coins. The Circular provides that gold, silver, medals and precious coins are normally carried at the lower of cost (see IAS 2, paragraphs 10-18) and net estimated recoverable amount (see IAS 2 paragraphs 6-7). 39 IOR Annual report 2016 According to IAS 8, the Institute considered the value as at 1 January 2015 (31 December 2014) as cost of the gold, silver and precious medals and coins, because was not feasible to make a measurement for the prior years. As of 31 December 2015, the value of gold was lower than the cost and this involved only a reclassification of the loss, already recorded in the previous financial year, from the item “Net income for trading activities” to the item “Other operating income (expense)”; no other economic impacts were recorded. The gold, silver, medals and precious coins held by the Institute are classified in the Balance Sheet, Item 150 Assets – “Other assets”. Gold is mainly deposited with the U.S. Federal Reserve, while medals and precious coins are kept in the IOR vaults. 1.1.4.1 Critical accounting estimates and judgements Critical judgements in applying the Institute accounting policies In the process of applying the accounting policies adopted by IOR, which are described in Section II, there may be circumstances that lead the Directorate to make judgements that have a significant impact on the amounts recognized in the financial statements. Such circumstances and related judgements may be part of the valuation process used for financial instruments. The Directorate makes critical judgements when deciding the asset category for classification, determining whether a market is active or not, whether the asset is liquid or illiquid, market inputs and parameters to be used, when they must be reviewed, and assessing circumstances where internal parameters are more reliable than market-based ones. Retirement benefits and other post-employment liabilities are estimated trough an actuarial valuation performed by an independent expert. Such an evaluation is based on critical judgements because estimates are made about the likelihood of future events and the actual results could differ from those estimates. Estimates that contain elements of uncertainty The process of applying the IOR’s accounting policies may require the use of key assumptions affecting the future, and/or other sources of estimation uncertainty as of the balance sheet date, with a significant risk of causing material adjustments to the carrying amount of assets and liabilities in the next financial year. Key assumptions and judgments made in the 2016 Financial Statements relate to the assessment of illiquid debt securities portfolio held for trading and external investment funds included within the portfolio held for trading, as disclosed in the section 1.4 “Fair value information”. Illiquid securities are not quoted in active markets and their fair value is not readily available in the market.These securities subject estimation uncertainties (Level 3 of fair value hierarchy) amounted to EUR 23.3m as of 31 December 2016 (2015: EUR 35.9m). These were exclusively comprised of externally managed investment funds. With reference to the liabilities related to commitments linked to externally managed investment funds, they are valued taking into account all available information at the date of preparation of these financial statements. This assessment is made on the basis of assumptions and the process of estimation in characterized by elements of uncertainty. By their nature, the estimates and assumptions used may vary from one period to another and, therefore, it can not be excluded that in subsequent periods the amounts of such liabilities may differ materially from those currently estimated as a result of new information and charges in the evaluations made. 40 IOR Annual report 2016 The IOR has also been working to review and confirm its tax position and that of its clients in countries where investment relationships exist. This review has identified probable contingencies that relate to prior years as a result of different interpretations regarding the legal nature of the Institute and the related applicable tax treatments. As of 31 December 2016, based on the reviews performed and supported by external legal advisors, the Institute has estimated a provision of EUR 3.5m, included in the Balance Sheet, item 130 “Provision for risks and charges” line b “Other provisions”. As this represents an estimate based on critical assumptions, actual results may differ from what is expected when the future event takes place. 1.1.5 Impact of New Accounting Pronouncements Accounting standards, amendments and interpretations IFRS effective 1 January 2016 The following accounting standards, amendments and interpretations IFRS were adopted for the first time by the IOR effective 1 January 2016: • Amendments to IAS 19 “Defined Benefit Plans: Employee Contributions” (published on 21 November 2013): the amendments relate to the accounting treatment for contributions made by employees or third parties to a defined benefit plan. The adoption of the amendments had no impact on the disclosures or the amounts recognized in the Institute’s financial statements. • Amendments to IFRS 11 “Accounting for acquisitions of interests in joint operations” (published on 6 May 2014): the amendments provide guidance on how to account for the acquisition of an interest in a joint operation whose activities constitute a business. The adoption of the amendments had no impact on the disclosures or the amounts recognized in the Institute’s financial statements. • Amendments to IAS 16 and to IAS 38 “Clarification of acceptable methods of depreciation and amortisation” (published on 12 May 2014):The amendments prohibit the use of revenue-based depreciation; the revenue generated by an activity that includes the use of the asset to be depreciated generally reflects factors other than just the consumption of economic benefits of the asset, which is a requirement for depreciation. The adoption of the amendments had no impact on the disclosures or the amounts recognized in the Institute’s financial statements. • Amendment to IAS 1 “Disclosure Initiative” (published on 18 December 2014): the purpose of the amendment is to provide clarification on disclosure items that may be perceived as presenting impediments to a clear and intelligible preparation of financial statements. The adoption of the amendments had no impact on the disclosures or the amounts recognized in the Institute’s financial statements. • Amendment to IAS 27 Equity Method in Separate Financial Statements (published on 12 August 2014): the amendment introduces the option to use the equity method in the separate financial statements of an entity for the valuation of investments in subsidiaries, jointly controlled entities and associated companies.The adoption of the amendments had no impact on the disclosures or the amounts recognized in the Institute’s financial statements. • Amendments to IFRS 10, IFRS 12 e IAS 28 “Investment Entities: Applying the Consolidation Exception” (published on 18 December 2014): the amendments contain changes relating to issues that arise from the application of the exception granted to the consolidation of investment entities. The adoption of the amendments had no impact on the disclosures or the amounts recognized in the Institute’s financial statements. Finally, as part of the annual process for the improvement of the accounting standards, dated 12 December 2013 the IASB published the document “Annual Improvements to IFRSs: 2010-2012 Cycle” (including IFRS 2 Share Based Payments – Definition of vesting condition, IFRS 3 Business Com- 41 IOR Annual report 2016 bination – Accounting for contingent consideration, IFRS 8 Operating segments – Aggregation of operating segments e Reconciliation of total of the reportable segments’ assets to the entity’s assets, IFRS 13 Fair Value Measurement – Short-term receivables and payables) and in 25 September 2014 the document “Annual Improvements to IFRSs: 2012-2014 Cycle” (including IFRS 5 – Non-current Assets Held for Sale and Discontinued Operations, IFRS 7 – Financial Instruments: Disclosure e IAS 19 – Employee Benefits) which partially integrate existing standards. The adoption of the annual improvements had no impact on the disclosures or the amounts recognized in the Institute’s financial statements. Accounting standards, amendments and interpretations IFRS and IFRIC approved by the European Union, not yet mandatorily applicable and not early adopted by the Institute at 31 December 2016 • Standard IFRS 15 – Revenue from Contracts with Customers (published on 28 May 2014 and amended on 12th April 2016) will replace the following standards and interpretations: IAS 18 – Revenue IAS 11 – Construction Contracts, IFRIC 13 – Customer Loyalty Programmes, IFRIC 15 – Agreements for the Construction of Real Estate, IFRIC 18 – Transfers of Assets from CustomersSIC 31 – Revenues-Barter Transactions Involving Advertising Services. The standard establishes a new revenue recognition model, which will apply to all contracts with customers except those that fall within the scope of other IAS / IFRS standards as leasing, the insurance contracts and financial instruments.This core principle is delivered in a five-step model framework: • Identify the contract(s) with a customer; • Identify the performance obligations in the contract; • Determine the transaction price; • Allocate the transaction price to the performance obligations in the contract; • Recognize revenue when (or as) the entity satisfies a performance obligation. The standard is effective for annual reporting periods beginning on or after 1 January 2018. Earlier application is permitted. However, the amendments to IFRS 15, Clarifications to IFRS 15 - Revenue from Contracts with Customers, published by the IASB on 12 April 2016, are not yet been endorsed by the European Union. At this stage, the Institute is evaluating the possible impacts of these changes on the financial statements. • Final version of IFRS 9 - Financial Instruments (published on 24 July 2014). The document recognized the results of IASB project to replace IAS 39: • Introducing new criteria for the classification and measurement of financial assets and liabilities; • With reference to the impairment model, the new standard requires that the estimate of credit losses is carried out on the basis of the expected losses model (and not on the incurred losses model used by IAS 39) using reasonable and supportable information about past events, current conditions and reasonable and supportable forecasts of future economic conditions; • Introducing a new hedge accounting model (types of transactions eligible for hedge accounting, changes in the method of accounting for forward contracts and options when included in a hedge relationship, changes in the effectiveness test). The new standard is effective for financial statements beginning on 1 January 2018 or later. The adoption of the IFRS 9 could have significant impacts on balance sheet income statement and disclosure. At the same time, for the time being the Institute is not able to provide a reasonable estimation of the above impacts without carrying out a thorough analysis. Accounting standards, IFRS amendments and interpretations not yet endorsed by the European Union. 42 IOR Annual report 2016 At the date of these financial statements, the relevant European Union bodies have not yet completed the approval process necessary for the adoption of amendments and the principles described below. • Standard IFRS 16 – Leases (published on 13 January 2016), will replace the following standards and interpretations: • IAS 17 – Leases, • IFRIC 4 Determining whether an Arrangement contains a Lease, • SIC-15 Operating Leases - Incentives, • SIC-27 Evaluating the Substance of Transactions Involving the Legal Form of a Lease. IFRS 16 establishes principles for the recognition, measurement, presentation and disclosure of leases, with the objective of ensuring that lessees and lessors provide relevant information that faithfully represents those transactions.This new standard brings most leases on-balance sheet for lessees under a single model, eliminating the distinction between operating and finance leases. Lessor accounting however remains largely unchanged and the distinction between operating and finance leases is retained. The Institute do not expect a significant impact in the financial statements from the application of this standard. • Amendments to IAS 7 “Disclosure Initiative” (published on 29 January 2016).The document aims to provide some clarification to improve disclosures about financial liabilities. In particular, the amendments required to provide disclosures that enable users of financial statements to evaluate changes in liabilities arising from financing activities. The amendments are effective from 1 January 2017, earlier adoption is permitted. It is not required to present comparative information relating to prior years.The Institute do not expect a significant impact in the financial statements from the application of this amendment. • Document “Applying IFRS 9 Financial Instruments with IFRS 4 Insurance Contracts” (published on 12 September 2016). For entities whose predominant activity is issuing contracts within the scope of IFRS 4, the document is intended to clarify the concerns arising from the application of the new IFRS 9 to financial assets. The Institute do not expect a significant impact in the financial statements from the application of this document. • Document “Annual Improvements to IFRSs: 2014-2016 Cycle”, published on 8 December 2016, provides partial integration on existing standards, that include: • IFRS 1 First-Time Adoption of International Financial Reporting Standards - Deletion of shortterm exemptions for first-time adopters, • IAS 28 Investments in Associates and Joint Ventures – Measuring investees at fair value through profit or loss: an investment-by-investment choice or a consistent policy choice, • IFRS 12 Disclosure of Interests in Other Entities – Clarification of the scope of the Standard. The adoption of the above improvement would not affect significantly the Financial Statements. • Interpretation IFRIC 22 “Foreign Currency Transactions and Advance Consideration” (published on 8 December 2016). The interpretation clarifies the accounting for transactions that include the receipt or payment of advance consideration in a foreign currency. This document provides guidance on how an entity should determine the date of a transaction, and consequently, the exchange rate to use in circumstances in which consideration is received or paid in advance of the recognition of the related asset, expense or income. IFRIC 22 is effective from 1 January 2018. Earlier adoption is permitted. The Institute considers that the application of the above interpretation would not affect significantly the Financial Statements. • Amendments to IAS 40 “Transfers of Investment Property” (published on 8 December 2016). These amendments clarify the transfer of a property to, or from, investment property. In particular, an entity shall reclassify a property to, or from, investment property only when there 43 IOR Annual report 2016 is evidence that there has been a change in use of the property. Such a change must be attributed to a specific event; a change of management’s intentions for the use of a property by itself does not constitute evidence of a change in use. The amendments are effective from 1 January 2018. Earlier adoption is permitted. The Institute considers that the application of the above amendments would not affect significantly the Financial Statements. • Amendments to IFRS 10 e IAS 28 “Sales or Contribution of Assets between an Investor and its Associate or Joint Venture” (published on 11 September 2014). The amendments address a conflict between the requirements of IAS 28 ‘Investments in Associates and Joint Ventures’ and IFRS 10 ‘Consolidated Financial Statements’ and clarify that in a transaction involving an associate or joint venture the extent of gain or loss recognition depends on whether the assets sold or contributed constitute a business. At this stage, the IASB suspended the application of these amendments. 1.2 INFORMATION ON THE MAIN FINANCIAL STATEMENT ITEMS 1.2.1 Financial assets held for trading A financial asset is classified under this category if acquired principally for the purpose of trading. Purchases of financial assets held for trading are initially recognized at the transaction date, which is the date on which the IOR commits to purchasing the asset. On initial recognition, financial assets held for trading are recognized at fair value, which generally corresponds to the initial cash consideration paid, excluding direct transaction costs or revenues directly attributable to the instrument. Subsequent to initial recognition, the financial assets are measured at fair value, with any gains or losses arising from the change in fair value recognized in the Income Statement. Disposals are recognized on the trade date which is the date on which the Institute commits to dispose the assets. Gains and losses arising from disposal or redemption and unrealised gains and losses arising from changes in the fair value are recognized in the Income Statement, item 80 “Net trading result”. Interest income and expense arising from the financial assets held for trading are recognized in the Income Statement on an accrual basis and recognized “pro rata” based on the contractual interest rate. These are recognized in the Income Statement, item 10 “Interest and similar income”. Dividends on financial assets held for trading are recognized in the Income Statement, item 70 “Dividend income” when the entity’s right to receive payment is established. For the fair value measurement please refer to Section 1.4, Fair value information. All financial assets held for trading are derecognized when the rights to receive cash flows from the financial assets have expired or when the IOR has substantially transferred all risks and rewards of ownership. 1.2.2 Financial assets available for sale Financial Assets classified as Available for sale are those intended to be held for an indefinite period of time, and those that are subject to agreements that restrict the sale for a specified period. 44 IOR Annual report 2016 In addition, financial assets classified available for sale include non-derivative financial assets that are not classified as held for trading or loans and receivables or held to maturity investments. Financial assets available for sale are initially recognized on the trade date, which is the date on which the IOR commits to purchasing the asset. Financial assets available for sale are initially recognized at fair value plus any direct transaction costs. Financial assets available for sale are subsequently measured at fair value, and any changes in the fair value are recognized in Other Comprehensive Income and therefore directly in an equity reserve. Disposals are recognized on the trade date which is the date on which the Institute commits to dispose the assets. At the time that the financial assets are derecognized or impaired, accumulated gain or loss from changes in the fair value of financial assets available for sale previously recognized in Other Comprehensive Income are reclassified and recognized in the Income Statement. When the financial assets available for sale are sold, any unrealised gains or losses previously recognized in Other Comprehensive Income, are reclassified into the Income Statement, item 100 “Profit (loss) on disposal or repurchase” line b “Financial assets available for sale”. In case of impairment losses, gains or losses previously recognized in Other Comprehensive Income are transferred to the Income Statement item 130 “Net losses/reversal on impairment” line b “Financial assets available for sale”. At each balance sheet date, the IOR assesses whether there is objective evidence of impairment on financial asset available for sale. A significant or prolonged decline in the fair value of the financial asset below its cost is considered as objective evidence of a reduction in value. If there is such evidence, the cumulative loss, measured as the difference between the acquisition cost and the current fair value, less previously recognized impairment loss, is transferred from equity and recognized in the Income Statement in item 130 “Net losses/reversal on impairment” line b. If, in a subsequent period, the amount of the impairment loss decreases, impairment losses recognized in the Income Statement on equity instruments are not reversed through the Income Statement, but through the Fair Value Reserves, a component of equity. For debt instruments classified as available for sale, if the fair value increases in a subsequent period and the increase can be objectively related to an event occurring after the impairment loss was recognized in profit or loss, the impairment loss is reversed through the Income Statement. The impairment policy adopted by IOR is that all equity securities classified as available for sale must be impaired when their market prices are below their carrying prices and the price decline is more than 20%, or when the decline to below the acquisition cost has persisted for more than 36 months. Interest income and expense arising from the financial assets available for sale are recognized in the Income Statement on an accrual basis and recognized “pro rata” based on the effective interest rate method. These are recognized in the Income Statement, item 10 “Interest and similar income”. Dividends on financial assets available for sale are recognized in the Income Statement, item 70 “Dividend income” when the entity’s right to receive payment is established. For the fair value measurement please refer to Section 1.4 “Fair value information”. All financial assets available for sale are derecognized when the rights to receive cash flows from the financial assets have expired or when the IOR has substantially transferred all risks and rewards of ownership. 45 IOR Annual report 2016 1.2.3 Financial assets held to maturity Financial assets held to maturity investments are quoted non-derivative financial assets with fixed or determinable payments and with fixed maturities which the IOR has the intention and ability to hold to maturity. If the IOR sells financial assets held to maturity, the entire category must be reclassified as available for sale and for two subsequent years, no financial asset can be classified in this category. Financial assets held to maturity are initially recognized at the trade date, which is the date on which the IOR commits to purchasing the asset, and are recognized at fair value plus any direct transaction costs. The financial assets held to maturity are subsequently measured at amortised cost using the effective interest rate method, and adjusted to take into account the effects of any impairment losses, when applicable the circumstances described below. Gains and losses on financial assets held to maturity are recognized in the Income Statement through the financial amortisation process (item 10 “Interest and similar income”) or when the assets are derecognized (item 100 “Profit (loss) on disposal or repurchase” line c “Financial assets held to maturity”) or when impairment losses are recognized in the Income Statement (item 130 “Net losses/reversal on impairment” line c “Financial assets held to maturity”). As of each balance sheet date, the IOR assesses whether there is objective evidence of impairment on financial asset held to maturity. A financial asset is impaired and impairment losses are recognized when one or more loss events occurred after the initial recognition of the asset and that loss event has an impact on the estimated future cash flows of the financial asset. The amount of the loss is measured as the difference between the asset’s carrying amount and the present value of estimated future cash flows discounted at the financial asset’s original effective interest rate. The carrying amount of the asset is directly reduced and the extent of the loss is recognized in the Income Statement item 130 “Net losses/reversal on impairment” line c “Financial assets held to maturity”. Interest income and expense arising from the financial assets held to maturity are recognized in the Income Statement on an accrual basis and recognized “pro rata” based on the effective interest rate method. These are recognized in the Income Statement, item 10 “Interest and similar income”. The effective interest method is a method calculating amortized cost of an asset or a financial liability and of allocating interest. The effective interest rate is the rate that makes the present value of expected cash flows until maturity of the financial instrument (or, if more reliable for a shorter period) exactly equal to the current book value. The calculation not only includes all fees and premiums or discounts received or paid to the counterparty, which are an integral part of the effective interest rate, but also the transaction costs and all other premiums or discounts. All financial assets held to maturity are derecognised when the rights to receive cash flows from the financial assets have expired or when the IOR has substantially transferred all risks and rewards of ownership. 1.2.4 Credits The item includes loans to customers and banks, with fixed or determinable payments, provided directly, not quoted in an active market and not initially classified as financial assets held for trading, available for sale or at fair value. 46 IOR Annual report 2016 The item includes: 1. authorized financing agreements where the Institute provides money directly to the customers without the intention of subsequent re-negotiation; 2. Loans and Receivables debt securities offered through private placements, which the Institute does not designate as financial assets at fair value through profit or loss or available for sale. These financial assets are subject to the risk of deterioration of the creditworthiness of the counterparty. Financing agreements are recognized when the amount is advanced to the borrower. They are initially recognized at fair value, which is the value of the loan, plus any direct transaction costs. Financing agreements are subsequently measured at amortised cost using the effective interest rate method. Securities are initially recognized on the trade date, which is the date on which IOR commits to purchasing the asset at fair value plus any direct transaction costs or income. Securities are subsequently measured at amortised cost using the effective interest rate method, and are subject to impaired test and impairment losses are recognized when one or more loss events occurred after the initial recognition of the asset and that loss event has an impact on the estimated future cash flows of the financial asset. When a loan becomes uncollectible, it is written off against the related provision for loan impairment. Such exposures are written off after all the necessary procedures have been performed and the extent of the loss has been determined. Subsequent recoveries of amounts previously written off are recognized in the Income Statement item 130 “Net losses/reversal on impairment” line a “Receivables”. Interest income and expense arising from loans and advances to customers are recognized in the Income Statement on an accrual basis and recognized “pro rata” using the effective interest rate method. These are recognized in the Income Statement, item 10 “Interest and similar income”. At each balance sheet date, the IOR assesses whether there is objective evidence of impairment. A financial asset is impaired and impairment losses are recognized when one or more loss events occurred after the initial recognition of the asset and that loss event has an impact on the estimated future cash flows of the financial asset. The amount of the loss is measured as the difference between the asset’s carrying amount and the present value of estimated future cash flows discounted at the financial asset’s original effective interest rate. The carrying amount of the asset is reduced through the use of a provision account and the extent of the loss is recognized in the Income Statement item 130 “Net losses/reversal on impairment” line a “Receivables”. Loans which are not individually impaired are subject to valuation on a portfolio basis based on historical data.The loss is recognized in the Income Statement item 130 “Net losses/reversal on impairment” line a “Receivables”. If, in a subsequent period, the impairment loss decreases and the decrease can be objectively attributed to an event occurring after the impairment was recognized (such as an improvement in the debtor’s credit rating), the previously recognized impairment loss is reversed by adjusting the allowance account.The amount of the reversal is recognized in the Income Statement, Statement item 130 “Net losses/reversal on impairment” line a “Receivables”. In any case, the reversal can not exceed the cost that the financial instrument prior to the recognition of any impairment loss. 47 IOR Annual report 2016 Credits are derecognized when the rights to receive cash flows from the financial assets have expired or when the IOR has substantially transferred all risks and rewards of ownership. Regarding loans to customers, at the end of each month, the Advances Department analyses all exposures and submits to the Directorate a proposal on how to manage aged loans at risk for noncollection. Particularly, when the balance is deemed to be collectible within a short period, an impairment loss is not realized, but the trend is monitored; when the balance is deemed to be collectible in a mid/long term period, an impairment loss is recognized; when the positions are past due and uncollectible, the department proposes a write-off the amount as a loss on loans to the Directorate. It is to be mentioned that the Institute is not authorized by the Autorità di Informazione Finanziaria to carry out the activity of “lending” (cfr. art. l (l) (b) of the Law n.XVIII and art. 3 (24) (b) of the Regulation No. l), as credit activities on its own. However, it is authorized to make “advances” that is to disburse funds to its clients and to a limited extent following guarantee of future income (such as, for example, in the case of the advance of salary or pension paid by the Holy See or the Governatorato of Vatican City) or guaranteed by financial assets of the same amount deposited by the clients at the Institute. 1.2.5 Derivative financial instruments and hedge accounting Derivatives are initially recognized at fair value on the date in which a derivative contract is entered into. The initial fair value generally corresponds to the initial cash consideration, and subsequently remeasured at fair value with changes recognized through profit or loss. The fair value of derivatives quoted in active markets is based on current bid prices. If the market for a financial derivative is not active, the IOR obtains fair value from third parties or establishes fair value by using valuation models that are primarily based on objective financial inputs, as well as considering prices utilised in recent transactions and prices of similar financial instruments. All derivatives are recognized as assets when the fair value is positive and as liabilities when fair value is negative. Derivative financial instruments may include embedded derivatives in a hybrid financial instrument. IAS 39 requires that an embedded derivative be separated from its host contract and accounted for as a derivative when: 1. The economic risks and characteristics of the embedded derivative are not closely related to those of the host contract; 2. A separate instrument with the same terms as the embedded derivative would meet the definition of a derivative; 3. The hybrid (combined) instrument is not measured at fair value with changes in fair value recognized through Income Statement. The Institute does not enter into Fair value hedges, Cash flow hedges or Net investment hedges for foreign currency transactions/positions. As of 31 December 2016 and 2015, the Institute did not hold derivatives. 48 IOR Annual report 2016 1.2.6 Investment in subsidiaries Investment in subsidiariesconsists of the stake in the wholly-owned real estatecompany SGIR, based in Rome, Via della Conciliazione. The principal assets of this company are real estate properties. Investment in subsidiaries is carried at cost, less impairment. Real estate owned by the subsidiary is depreciated on a straight-line basis over its estimated useful life which management considers as between 30 and 50 years. Land is not depreciated. 1.2.7 Tangible assets 1.2.7.1 Tangible assets for investment - Investment properties Investment properties are properties directly owned by the IOR. These are buildings not owneroccupied, but inherited and held to generate rental income, capital appreciation or both. Investment properties are initially measured at cost (which is zero in case of inheritances) and subsequently at fair value with any change recognized in the Income Statement, item 220 “Net result of fair value valuation of tangible and intangible assets”. Improvements to buildings increase their carrying amounts. 1.2.7.2 Tangible assets for business activities - Equipment, furniture and vehicles All equipment, furniture and vehicles are stated at historical cost, minus accumulated depreciation. Historical cost is generally based on the fair value of the sum paid in exchange for assets and includes expenditure that is directly attributable to the acquisition of the items. Subsequent costs are included in the asset’s carrying amount or are recognized as a separate asset, as appropriate, only when it is probable that the IOR will recognise future economic benefits associated with the item. All repairs and maintenance costs are charged to the Income Statement in the year they are incurred. Equipment, furniture and vehicles are amortised on a straight-line basis over their expected useful lives (four years). The asset’s residual values and useful lives are reviewed, and adjusted if appropriate, on each balance sheet date. These assets are reviewed for impairment whenever events or changes in circumstances indicate that the carrying amount may not be recoverable. An asset’s carrying amount is written down immediately to its recoverable amount if the asset’s carrying amount is greater than its estimated recoverable amount.The recoverable amount is the higher of the asset’s fair value less costs to sell and its value in use. The result of the impairment test and the depreciations are recognized in the Income Statement item 170 “Net value adjustments to/recoveries on tangible assets”. Gains and losses on disposals are determined as the difference between the sale proceeds and the carrying amount of the assets.They are recognized in the Income Statement, under item 190 “Other operating income (expense)”. 49 IOR Annual report 2016 1.2.8 Intangible assets Intangible assets correspond to computer software licenses and to expenses related to their implementation. Acquired computer software licenses are recognized at acquisition costs, including costs incurred to bring the specific software into use. These costs are amortised on a straight-line basis over their expected useful lives (four years). These assets are reviewed for impairment whenever events or changes in circumstances indicate that the carrying amount may not be recoverable. An asset’s carrying amount is written down immediately to its recoverable amount if the asset’s carrying amount is greater than its estimated recoverable amount. The recoverable amount is the higher of the asset’s fair value less costs to sell it and its value in use. The result of the impairment test and the depreciations are recognized in the Income Statement item 180 “Net value adjustments to/recoveries on intangible assets”. Costs associated with maintenance of computer software programmes are recognized as an expense in the Income Statement when they are incurred. 1.2.9 Due to banks and to customers Due to banks comprises interim current accounts overdrafts, as the Institute does not carry out funding activites on the interbank market. Due to customers are composed by financial instruments (different from trading liabilities) that assumed the typical forms of funds, realised by IOR with customers. The mentioned financial liabilities are recorded in the financial statements on the settlement date. They are initially recognized at the current value, which normally corresponds to the amount collected.The initial recognition value includes possible expenses and incomes from anticipated transaction and directly attributable to each liability; not included in the initial carrying amount are all charges which are paid back by the credit counterparty or that are attributable to internal administrative expenses. After the initial recognition, due to banks and to customers are measured at amortized cost using the effective interest rate method.The short-term liabilities remain recorded at the amount received. Interest expense related to due to banks and to customers are recognized in the income statement, item 20 “Interest and similar expense”. Due to banks and to customers are derecognized when they expired or extinguished. 1.2.10 Legates According to the Canon Law (Can. 1303), the term “Legati – non autonomous pious foundation” comprises: “temporal goods given in any way to a public juridical person and carrying with them a long-term obligation, such a period to be determined by particular law. The obligation is for the juridical person, from the annual income, to celebrate Masses, or to perform other determined ecclesiastical functions, or in some other way to fulfil the purposes mentioned in Can. 114, par. 2”. Based on such definition, this is understood to be an arrangement whereby capital is donated or willed to the IOR for religious or charitable purposes, based on the understanding that the transferred capital is invested on a long term basis and the annual income earned from the investment 50 IOR Annual report 2016 is devoted to the fulfilment of the purpose prescribed by the donor. Under these provisions, the IOR will administer the capital in accordance with the purpose prescribed by the donor (e.g., for Holy Mass Intention or scholarships). Legates are recognised in the financial statement on the settlement date. Legates are initially recognised at the current value, which normally corresponds to the amount received. The initial recognition value includes also expenses and incomes for anticipated transaction and directly attributable to each liability; not included in the initial carrying value are all charges which are paid back by the credit counterparty or that are attributable to internal administrative expenses. The interest expense related to the Legates are recognized in the income statement, item 20 “Interest and similar expense”. Legates are derecognised when they expired or extinguished. 1.2.11 Staff severance fund Staff severance fund is a post-employment benefit that correspond to indemnities paid to personnel when they leave the IOR. The amount due is based on years of service and salary paid in the last year of employment.These benefits are financed by contributions from employees and the IOR. The liability is measured with utilizing certain actuarial assumptions, as the present value of the estimated future cash outflows according to the projected unit credit method required by IAS 19. Remeasurements arising from the defined benefit plan comprise actuarial gains and losses, recognized in Other Comprehensive Income. All other expenses related to the defined benefit plan in the Income Statement, item 150 “Administrative Expenses”, line a “Staff expenses”. 1.2.12 Provisions for risks and charges - Pension fund and similar obligations For the pensions of its employees, the IOR operates a defined benefit plan, which is financed by contributions from employees and the IOR. The IOR’s net liabilities related to the defined benefit plan for pensions is calculated by estimating the amount of future benefit that employees will earn in return for their service in the current and prior periods; that benefit is discounted to determine its present value. The IOR determines the interest expense on the defined benefit liability for the year by applying the discount rate used to measure the same liability at the beginning of the year. The discount rate is the yield on the reporting date from high quality corporate bonds that have maturity dates approximating the terms of the IOR’s liabilities and that are denominated in the currency in which the benefits are expected to be paid. The calculation is performed annually by a qualified actuary, who assesses the fairness of the liability, using the projected unit credit method. Remeasurements arising from the defined benefit plan comprise actuarial gains and losses. The IOR recognizes them immediately in Other Comprehensive Income and all other expenses related to the defined benefit plan in the Income Statement, item 150 “Administrative expenses”, line a “Staff expenses”. When the benefits of the plan are changed, the portion of the changed benefit related to past service by employees is recognized immediately in the Income Statement. On 1 January 2005, all IOR personnel also joined the general Vatican City State pension plan.This system is financed by contributions made by the Institute and employees. Contributions to the Vat- 51 IOR Annual report 2016 ican plan made by the IOR are recognized in the Income Statement, item 150 “Administrative expenses”, line a “Staff expenses” when they occur. Consequently, the IOR’s defined benefit plan for pensions covers the entire amount to be paid by the Institute to employees for their service up to 31 December 2004. For the employees’ services from 1 January 2005, the obligation is limited to the part not covered by the Vatican City State Pension Plan taking into account the difference in the retirement age of the two pension systems. 1.2.13 Foreign Currency Transactions Functional and presentation currency The functional currency is the currency in which the items included in the financial statements must be measured. According to IAS 21 “The effects of changes in foreign exchange rates” the functional currency is the currency of the primary economic environment in which the entity operates. This is the currency that determines the pricing of transactions, but it is not necessarily the currency in which transactions are denominated. The reporting currency is the currency in which the financial statements are prepared. IAS 21 allows an entity to prepare its financial statements in any currency. The IOR’s functional and presentational currency is the Euro, which is the currency of the primary economic environment in which the Institute operates. Transactions and balances Foreign currency transactions, if they impact profit or loss accounts, are converted into the functional currency using the exchange rates applicable at the date of the transaction. Monetary assets and liabilities denominated in foreign currencies are converted into the functional currency using the spot exchange rate at the reporting date (closing rate). Non-monetary assets and liabilities denominated in foreign currencies are translated using the rate at the date their amount (cost or fair value) was determined. Non-monetary items carried at cost are converted at the exchange rate at the date of initial recognition in the financial statements. Non-monetary items carried at fair value are translated using the rate at the date of the determination of their fair value. Foreign exchange gains and losses resulting from the settlement of foreign currency transactions and from the conversion at year-end exchange rates of monetary assets and liabilities denominated in foreign currencies are recognized in the Income Statement, item 80 “Net income for trading activities”. Foreign exchange gains and losses resulting from the conversion at year-end exchange rates of nonmonetary assets and liabilities are: • recognized in the Income Statement as part of the fair value gain or loss if the non-monetary assets and liabilities are carried at fair value through profit and loss; • included in the fair value reserves in the equity if the non-monetary assets and liabilities are car- 52 ried at fair value in the equity. IOR Annual report 2016 1.2.14 Offsetting financial instruments Financial assets and liabilities are offset and the net amount is reported on the Balance Sheet only when there is a legally enforceable right to offset the recognized amounts and there is an intention to settle on a net basis. Otherwise, the financial assets and liabilities are separately reported on the balance sheet. 1.3 TRANSFERS BETWEEN PORTFOLIOS The amendments to IAS 39 and to IFRS 7 “Reclassification of financial assets” allow for the reclassification of certain financial assets after their initial recognition, out of the held for trading (HFT) and available for sale (AFS) portfolios. In particular, those HFT or AFS financial assets that would have met the definition specified by international accounting standards for the loan portfolio (if such assets were not classified as HFT or AFS respectively on initial recognition) may be reclassified if the entity intends, and is able, to hold them for the foreseeable future or until maturity. The Institute did not have any transfers between portfolios in 2016 and in previous years. 1.4 FAIR VALUE INFORMATION 1.4.1 Qualitative fair value information For the measurement of fair value, the amendments to IFRS 7 and subsequent changes introduced by IFRS 13 defines a fair value hierarchy based on level of observable inputs, valuation techniques adopted and parameters used for measurement. The financial assets are classified according to the following hierarchy that consists of three levels. Level 1 In Level 1, the fair value is measured using the quoted prices in active markets for the financial assets and liabilities to be evaluated. A financial instrument is considered quoted in an active market when its price is: • readily and regularly available on stock exchanges, from information providers or intermediaries; • significant, meaning that it represents effective market transactions regularly occurring in normal transactions. To be considered Level 1, the price should be not be adjusted through an adjustment factors (valuation adjustment). If it is adjusted, the measurement at fair value of financial instrument will be Level 2 or Level 3. Level 2 A financial instrument is included in Level 2 when the inputs utilised to measure fair value are directly or indirectly observable in the market. The parameters of Level 2 are as follows: • prices quoted on active markets for similar assets or liabilities; • price quoted on non-active markets for similar or identical assets and liabilities; 53 IOR Annual report 2016 • market observable inputs other than the quoted price for the asset or liability (interest rates, yield curve, credit spreads, volatility); • parameters that derive mainly (or are corroborated by correlation or other techniques) from observable market data (market-corroborated inputs). An input is observable when it reflects the assumptions that market participants would use in pricing an asset or liability based on market data provided by sources independent of the reporting entity. Valuation techniques used to determine fair value that should be used when the market price is not available or is not significant, must meet three conditions. They must: 1. be methodologically consolidated and widely accepted; 2. utilise market inputs disclosed above; 3. be periodically reviewed. Valuation techniques used for fair value measurement should be periodically assessed using inputs observable in the markets to ensure that outputs reflect actual data and comparative market prices and to identify any weaknesses. If the fair value measurement utilise observable inputs that require a significant adjustment based on unobservable inputs, the financial instrument should be considered in Level 3. Level 3 Included in Level 3 are financial instruments valued using inputs unobservable market data (unobservable inputs). To be included in Level 3, at least one of the inputs must be unobservable on the market. Level 3 financial instruments are valued using inputs are not derived from independent sources but on the reporting entity’s own assumptions based on assumptions that market participants would use, based on observable inputs. IFRS 13 specifies a hierarchy of fair value measurements based on whether the inputs are observable or unobservable. Observable inputs reflect the assumptions that market participants would use in pricing the asset or liability based on market data obtained from sources independent of the reporting entity. The market price is the most observable and objective input (Level 1). Where no active markets exists or where quoted prices are not available, the entity determines the fair values by using valuation techniques. Valuation techniques can utilise inputs observable on the market (Level 2) or non-observable inputs (Level 3). The above mentioned valuation approaches should be applied in a hierarchical order. When there is availability of quoted market prices in active markets, an entity must measure fair value using Level 1 inputs. Furthermore, the valuation techniques used should prioritise the utilization of inputs observable on the market and should rely as little as possible on the reporting entity’s own data, internal valuations or unobservable inputs. Fair value level 2 and 3: valuation techniques and input used The criteria used by the IOR to determine the fair value of financial instruments are as follows. The fair values of investments held by the IOR quoted in active markets are usually based on current bid prices. A financial instrument is considered as quoted in active markets if the prices are readily and regu- 54 IOR Annual report 2016 larly available in an exchange or regulatory agency and those prices represent actual market transactions that occur regularly on an arm’s length basis. In the absence of an active market, or in the event the market at the time of the valuation is not considered active, for example, in case of illiquid markets, the valuation techniques adopted by IOR are based on the use of recent arm’s length transactions in the market, even on a non-active market, relative to identical financial instrument or financial instruments with similar characteristics. The valuation techniques include the discounted cash flow analysis and other valuation techniques commonly used by market participants. If recent transactions of the same or similar instruments are not available, the IOR uses valuation techniques based on market parameters or other parameters. When using valuation techniques, the IOR tries to use observable market data, reducing its reliance on internal data. Valuation techniques are periodically reviewed for applicability, assessing the quantity and the quality of information available as of the balance sheet date, in order to correctly reflect any changes in the market. For the same reason, adjustments to market inputs, utilised in a certain model, can change from time to time. Consequently IOR models ensure that outputs reflect actual data and comparative market prices. In Level 1, the IOR has classified all financial instruments quoted in active markets. Under Level 2, the IOR has classified all illiquid financial instruments, include those that are structured or unstructured, as well as listed external investment funds that are not immediately payable and unlisted investment funds with investments in listed instruments. The basis for the valuation of illiquid securities follow prices provided by the securities issuer. These prices are internally verified and tested utilising internal models and observable market parameters and, in case of discrepancies, adjusted considering the result of the above-mentioned analysis. They are also adjusted on the basis of valuations from independent sources. Under Level 3, the IOR has classified equity securities that are not quoted or other financial instruments for which fair values are determined using a model based on internal parameters. To the extent that this is practical, the models use only observable data. However, areas such as default rates, volatilities and correlations require the Directorate to make estimates. In this category the Institute has also classified other assets: • for which the IOR did not receive independent valuations; • for which the IOR does not have access to financial information; • for which, despite having financial information, the Institute believes that the valuation of underlying assets, due to the nature of the investment, is based on valuation parameters that are not immediately observable in the market; • for which the IOR has received independent expert valuations (i.e. for investment properties). The NAV of funds, defined as the difference between the current value of the assets and liabilities of the fund, a Fair Value Adjustment was calculated to include other risk factors. The Fair Value Adjustment (FVA) is defined as the amount to be added to the mid-price observed in markets, rather than the price determined by the model, with the aim of obtaining the fair value of the position. The FVA includes the uncertainty inherent in the valuation of a financial instrument with the goal of reducing the risk of incorrect valuations in the financial statements and en- 55 IOR Annual report 2016 suring that fair value reflects the realised price of a market transaction that is actually possible; and incorporating possible future costs. The Institute adjusts the value of financial instruments measured at fair value on a recurring basis classified as Level 2 and Level 3 based on credit risk (Credit Valuation Adjustment), liquidity risk related to the disinvestment, close-out costs and available informations about the outstanding assets. With regard to the Credit Valuation Adjustment, the Institute considered the impact of fair value on credit risk of the counterparty and the country using the following inputs: • PD (Probability of Default) linked to the rating of counterparty (if not available the PD corresponding to an investment with an S&P rating of BBB was used); • LGD (Loss Given Default) based on the estimated level of expected recovery in case of counterparty default and defined through market benchmark and based on experience.The percentage used was 60%. Regarding the close-out cost, an adjustment is applied on the NAV of external investment funds if close-out penalties are stipulated. Sensitivity Analysis For fair value measurements where significant unobservable inputs are used (level 3), a sensitivity analysis is performed in order to obtain the range of reasonable alternative valuations. The Institute takes into account that the impact of unobservable inputs on the measurement of fair value of Level 3 depends on the correlation between the different inputs used in the valuation process. A sensitivity analysis was performed using a stress test on the PD and LGD by +/-5% and it did not have a significant impact to the value of the investments classified as Level 3. Fair value hierarchy (transfers between portfolios) With reference to financial assets and liabilities measured at fair value on a recurring basis, transfers between the fair value hierarchy were based on the following guidelines. For debt securities, transfers from level 3 to level 2 occurs when the relevant parameters used as inputs to the valuation technique are observable on the market. Transfers from level 3 to level 1 occurs when the presence of an active market has been verified, as defined by IFRS 13.Transfers from level 2 to level 3 occurs when some of the relevant parameters for determination of fair value are no longer directly observable on the market. For equity instruments classified as available- for- sale, transfers between the fair value hierarchy occurs: • during the period, when market observable inputs become available (e.g. prices are determined in comparable transactions on the same instrument between independent and knowledgeable counterparties), the Institute proceeds with the reclassification from level 3 to level 2; • when inputs that are directly or indirectly observable in the market used as the basis for the valuation no longer exist, or no longer updated (e.g. No recent comparable transactions or market multiples are no longer applicable) and no other inputs are available, the Institute uses valuation techniques that use unobservable inputs. Information on assets measured at fair value on a recurring basis We provide below the IFRS 13 disclosure requirements about assets measured at fair value on a recurring basis. By definition, the carrying value of these items corresponds to the fair value. 56 IOR Annual report 2016 Fair value is defined as the price that would be received in selling an asset or paid when transferring a liability in an ordinary transaction between market participants at the measurement date (i.e. an exit price). Financial assets held for trading These consist of: • Debt securities: the Institute has investments in debt securities valued at market price (markto-market) and regularly traded in active, liquid markets. Consequently, these instruments are classified as Level 1 in the fair value hierarchy, except for some bonds whose prices are determined internally on the basis of similar instruments quoted on active markets and are classified as Level 2; these amounted to EUR 81.5m. • Equity securities: the Institute has investments in equity securities valued at market price (markto-market) and regularly traded in active, liquid markets. Consequently, these instruments classified as Level 1 in the fair value hierarchy. • Investments funds: the Institute has external investment funds amounting to EUR 33.7m. With the exception of a fund of EUR 10.4m as Level 2 (liquid with monthly NAV), investment funds are classified as Level 3. Consequently, at 31 December 2016, a total of EUR 10.4m was classified as Level 2, while the remaining amount for EUR 23.3m was Level 3. Financial assets available for sale These are mainly classified as Level 1, comprise of shares quoted in active, liquid markets, except for two unlisted equity securities, one classified as Level 2 and the other classified as Level 3. Tangible assets for investment This item is comprised of properties directly owned by the Institute. The fair value of the properties is assessed by a qualified, independent expert. The appraisal is based on the real estate market data collected through surveys carried out by major industry players. The parameters used also reflect expert assumptions based on available information. For these reasons, the investment properties are classified as Level 3 on the fair value hierarchy. Assets not measured at fair value on a recurring basis For assets and liabilities not measured at fair value on a recurring basis, the following is the information is required by IFRS 13. Financial assets held to maturity The fair value of financial assets held to maturity securities corresponds to the market value at the balance sheet date. The securities are classified as Level 1 in the fair value hierarchy since they are regularly traded on active, liquid markets. Due from banks This item is comprised of deposits on demand and time deposits with banks in addition to financial “Loans and Receivables” securities issued by banks. Assuming that time deposits do not exceed ninety days, the carrying value of bank deposits, at the balance sheet date, approximates fair value and they are recorded in Level 1 of the fair value hierarchy. For “Loans and Receivables” securities, the fair value represents the market value at the closing date of the financial statements. 57 IOR Annual report 2016 By definition, “Loans and Receivables” securities are not quoted in active, liquid markets, but the valuation is sent weekly by the counterparty and is verified through an internal model. For these reasons, “Loans and Receivables” securities are classified in Level 2 of the fair value hierarchy. Due from customers This item is comprised of receivables due from credits granted as advances to clients in addition to “Loans and receivables” securities issued from entities other than banks. For Doubtful loans considered to be non-collectible, the Institute proceeded in the calculation of a specific impairment loss, and the carrying value represents fair value. With regards to other receivables, the fair value was calculated as follows: • Loans and credit lines: calculated by discounting future cash flows using a discount rate representative rate for the Institute; • Overdrafts: given their nature, the value of overdrafts approximates fair value. For “Loans and Receivables” securities the fair value represents the market value at the closing date of the financial statements. By their nature, “Loans and Receivables” securities are not quoted in active, liquid markets, but the valuation is sent weekly by the counterparty and is controlled through an internal model. For these reasons, “Loans and Receivables” securities are classified in Level 2 of the fair value hierarchy. Liabilities not measured at fair value on a recurring basis Due to banks The carrying value of this item approximates fair value, considering their short maturity. Due to customers This item is comprised of client deposits on demand and time deposits, liquid accounts and term deposits related to Asset Management positions. Their carrying value approximates fair value, considering the short maturity. As the fair value calculation is based on parameters not observable on markets, not even indirectly, these are classified as Level 3 in the fair value hierarchy. 58 IOR Annual report 2016 1.4.2 Quantitative fair value information 1.4.2.1 Fair value hierarchy (a) Assets and liabilities measured at fair value on a recurring basis: detail by fair value level 2016 2015 L1 L2 L3 L1 L2 L3 1. Financial assets held for trading 1,802,904 91,923 23,277 1,499,512 132,512 35,942 2. Financial assets carried at fair value 3. Financial assets available for sale 6,157 499 8 13,348 1,811 8 4. Hedging derivatives 5. Tangible assets 2,980 2,897 6. Intangible assets Total 1,809,061 92,422 26,265 1,512,860 134,323 38,847 1. Financial liabilities held for trading 2. Financial liabilities carried at fair value 3. Hedging derivatives Total Key: L1 = Level 1 L2 = Level 2 L3 = Level 3 (b) Annual changes of assets measured at fair value on a recurring basis (Level 3) The following table provides information about the assets measured at fair value on a recurring basis and categorized as Level 3 in the fair value hierarchy at the beginning of the year, disposals and/or additions during the year, and their final values at the balance sheet date. Financial assets Financial assets Tangible held for available assets trading for sale 1. Opening balance 35,942 8 2,897 2. Additions 2.1 Purchases 2.2 Profit recognized in: 2.2.1 Income Statement 1,693 136 - of which Gains 1,693 136 2.2.2 Net Equity 2.3 Transfers from other levels 2.4 Other variations in addition 3. Disposals 3.1 Sales 3.2 Reimbursement 3.3 Losses recognized in: 3.3.1 Income Statement (14,358) (53) - of which Losses (14,358) (53) 3.3.2 Net Equity 3.4 Transfers to other levels 3.5 Other variations in reduction 4. Closing balance 23,277 8 2,980 59 IOR Annual report 2016 (c) Annual changes of liabilities measured at fair value on a recurring basis (Level 3) The Institute did not hold liabilities measured at fair value on a recurring basis. d) Assets and liabilities not measured at fair value or measured at fair value on a non-recurring basis: detail by fair value level 2016 2015 BV L1 L2 L3 BV L1 L2 L3 1. Financial assets held to maturity 558,956 583,392 614,818 650,020 2. Due from banks 643,229 643,229 644,089 618,660 25,330 3. Due from customers 29,153 30,418 86,234 62,116 25,374 Total 1,231,338 1,226,621 30,418 1,345,141 1,268,680 87,446 25,374 1. Due to banks 10,597 10,597 2. Due to customers 2,398,924 2,398,924 2,323,403 2,323,403 Total 2,398,924 2,398,924 2,334,000 10,597 2,323,403 Key: BV = Book Value L1 = Level 1 L2 = Level 2 L3 = Level 3 1.5 INFORMATION ON “DAY ONE PROFIT/LOSS” The Institute did not earn day one profit/loss from financial instruments pursuant to paragraph 28 of IFRS 7 and other related IAS/IFRS paragraphs. 60 IOR Annual report 2016 PART 2. INFORMATION ON THE BALANCE SHEET ASSETS ITEM 10 - CASH AND CASH EQUIVALENTS Detail 2016 2015 (a) Cash 15,216 16,213 (b) Free deposits ex art. 9 (b) 35,634 98,524 (c) Free deposits ex art. 9 (c) (d) Other free deposits Total 50,850 114,737 The balance included in (b) represent free deposits with Public Authorities of the Holy See and Vatican City State with the statutory purpose of administering the assets owned by the Holy See (at present APSA). ITEM 20 ASSETS - FINANCIAL ASSETS HELD FOR TRADING 2.1 Detail by asset type 2016 2015 L1 L2 L3 L1 L2 L3 A. Cash assets 1. Debt securities 1.1 Structured securities 1.2 Other debt securities 1,750,174 81,519 1,436,403 127,125 2. Equity securities 52,730 63,109 3. UCI units 10,404 23,277 5,387 35,942 4. Loans 4.1 Outstanding repos 4.2 Other Total A 1,802,904 91,923 23,277 1,499,512 132,512 35,942 B. Derivatives 1. Financial derivatives 1.1 Held for trading 1.2 Related to the fair value option 1.3 Other 2. Credit derivatives 2.1 Held for trading 2.2 Related to the fair value option 2.3 Other Total B Total (A+B) 1,802,904 91,923 23,277 1,499,512 132,512 35,942 The table shows all financial assets, by type, allocated to the trading portfolio and classified in the fair value hierarchy (L1, L2 or L3) according to their nature. Financial assets held for trading is primarily comprised of debt securities classified as level 1 in the 61 IOR Annual report 2016 fair value hierarchy; the only financial assets classified as level 3 are shares of UCI units. As of 31 December 2016, similar to the prior year, the Institute did not have any derivative financial instruments in the trading portfolio. 2.2 Detail by borrowers/issuers 2016 2015 A. Cash assets 1. Debt securities (a) Public entities 912,466 546,426 (b) Financial companies 703,239 705,268 (c) Insurance companies 9,286 21,217 (d) Non financial companies 206,702 290,617 (e) Other subjects 2. Equity securities (a) Banks (b) Other issuers: - insurance companies 2,759 1,074 - financial companies 36,529 57,654 - non financial companies 13,442 4,381 - other 3. UCI units 33,681 41,329 4. Loans (a) Public entities (b) Financial companies (c) Insurance companies (d) Non financial companies (e) Other subjects Total A 1,918,104 1,667,966 B. Derivatives (a) Banks (b) Customers Total B Total (A+B) 1,918,104 1,667,966 UCI units in the financial assets held for trading refers exclusively to investment funds managed by third parties composed by equity securities. Regarding the composition of the funds, refer to the table included in section 5.2.6 “Information on unconsolidated structured entities” of Part 5 “Information on risks and hedging policies”. No borrowers/issuers are residents of the Vatican City State. Line (a) Public entities of the item A.1 Debt securities is exclusively comprised of securities issued by Foreign Central Public Administrations. In the portfolio of financial assets held for trading there are no equity securities classified as in default or at the risk of default. 62 IOR Annual report 2016 ITEM 40 ASSETS - FINANCIAL ASSETS AVAILABLE FOR SALE 4.1 Detail by asset type 2016 2015 L1 L2 L3 L1 L2 L3 1. Debt securities 1.1 Structured securities 1.2 Other debt securities 2. Equity securities 2.1 Carried at fair value 6,157 499 13,348 1,811 2.2 Carried at cost 8 8 3. UCI units 4. Loans Total 6,157 499 8 13,348 1,811 8 4.2 Detail by borrowers/issuers 2016 2015 A. Cash assets 1. Debt securities (a) Public entities (b) Financial companies (c) Insurance companies (d) Non financial companies (e) Other subjects 2. Equity securities (a) Banks (b) Other issuers: - insurance companies 6,157 13,348 - financial companies - non financial companies 507 1,819 - other 3. UCI units 4. Loans (a) Public entities (b) Financial companies (c) Insurance companies (d) Non financial companies (e) Other subjects Total A 6,664 15,167 No borrowers/issuers are resident in the Vatican City State. In the portfolio of financial assets available for sale, there are no equity securities classified in default or at the risk of default. 4.3 Financial assets available for sale with specific hedges The Institute did not hold financial assets available for sale with specific hedges. 63 IOR Annual report 2016 ITEM 50 ASSETS - FINANCIAL ASSETS HELD TO MATURITY 5.1 Detail by asset type 2016 2015 FV FV BV L1 L2 L3 BV L1 L2 L3 1. Debt securities - structured - other 558,956 583,392 614,818 650,020 2. Loans Total 558,956 583,392 614,818 650,020 Key: BV = book value, FV = fair value Financial assets held to maturity is mainly comprised of government bonds issued by European countries and bonds issued by international financial entities. As of 31 December 2016, securities with maturity less than 1 year (31 December 2017) had a balance sheet value amounting to EUR 316.4m. 5.2 Detail by borrowers/issuers 2016 2015 1. Debt securities (a) Public entities 441,580 518,262 (b) Financial companies 88,033 66,998 (c) Insurance companies (d) Non financial companies 29,343 29,558 (e) Other subjects 2. Loans (a) Public entities (b) Financial companies (c) Insurance companies (d) Non financial companies (e) Other subjects Total 558,956 614,818 No borrowers/issuers are residents of the Vatican City State. Line (a) Public entities of the item A.1 Debt securities is exclusively comprised of securities issued by Foreign Central Public Administrations. 5.3 Financial assets held to maturity with specific hedges The Institute did not hold financial assets held to maturity with specific hedges. 64 IOR Annual report 2016 ITEM 60 ASSETS - DUE FROM BANKS 6.1 Detail by type 2016 2015 FV FV BV L1 L2 L3 BV L1 L2 L3 A. Credits ex art. 14 (c) 1. Fixed-term deposits 77,104 77,104 60,707 60,707 2. Outstanding repos 3. Others B. Credits ex art. 14 (d) 1. Fixedterm deposits 2. Outstanding repos 3. Others C. Due from banks 1. Loans 1.1 Current accounts and demand deposits 457,624 457,624 265,426 265,426 1.2 Outstanding repos 108,501 108,501 292,527 292,527 1.3 Other loans: (a) Outstanding repos (b) Finance lease (c) Other 2. Debt securities 2.1 Structured securities 2.2 Other debt securities 25,429 25,330 Total 643,229 643,229 644,089 618,660 25,330 Key: BV = book value, FV = fair value No assets impairment was recorded. Line A. Credits ex art. 14 (c) is comprised of different deposits from free deposits held with the Public Authorities of the Holy See and Vatican City State with the statutory purpose of administering the assets owned by the Holy See (at present, APSA). 6.2 Credits with specific hedges The Institute did not hold credits with specific hedges and it has not outstanding finance leases. 65 IOR Annual report 2016 ITEM 70 ASSETS - DUE FROM CUSTOMERS 7.1 Detail by type 2016 2015 Book value Fair value Book value Fair value Impaired Impaired Non Purch- Other L1 L2 L3 Non Purch- Other L1 L2 L3 impaired ased impaired ased A. Loans 1. Current accounts 8,424 27 8,451 518 53 570 2, Outstanding repos 3. Mortgages 4. Credit cards, personal loans and loans on salary 5. Finance lease 6. Factoring 7. Other loans 12,495 8,207 21,967 13,416 9,944 24,804 B. Debt securities 1. Structured securities 2. Other debt securities 62,303 62,116 Total 20,919 8,234 30,418 76,237 9,997 62,116 25,374 Additional supporting information is provided in Part 5 “Information on risks and related hedging policies” of this document. It is to be mentioned that the Institute is not authorized by the Autorità di Informazione Finanziaria to carry out the activity of “lending” (cfr. art. l (l) (b) of the Law n. XVIII and art. 3 (24) (b) of the Regulation No. l), as credit activities on its own. However, it is authorized to make “advances” that is to disburse funds to its clients and to a limited extent following guarantee of future income (such as, for example, in the case of the advance of salary or pension paid by the Holy See or the Governatorato of Vatican City) or guaranteed by financial assets of the same amount deposited by the clients at the Institute. 7.2 Detail by borrowers 2016 2015 N Impaired Impaired on Non impaired Purchased Other impaired Purchased Other 1. Debt securities (a) Public Entities (b) Financial companies 52,304 (c) Insurance companies 10,000 (d) Non financial companies (e) Other subjects 2. Loans to: (a) Public Entities 8,290 (b) Financial companies (c) Insurance companies (d) Non financial companies 3,315 3,510 (e) Other subjects 9,314 8,234 10,423 9,997 Total 20,919 8,234 76,237 9,997 66 IOR Annual report 2016 7.3 Credits with specific hedges The Institute did not hold credits with specific hedges. ITEM 100 ASSETS – INVESTMENT IN SUBSIDIARIES 10.1 Information on investment in subsidiaries The Institute holds a financial investment in a real estate company, SGIR S.r.l., which is based in Italy and is 100% owned by the IOR. 10.2 Material investments in subsidiaries: book value, fair value and dividends received The value of the investment in the real estate company SGIR S.r.l. was EUR 15.8 m. There was no change in the value of the investment during 2016 and no dividends were paid. The equity of SGIR S.r.l. as of 31 December 2016 was EUR 22.6m (2015: EUR 22.1m), including EUR 12.4m (2015: EUR 12.4m) for a Fiscal Revaluation Reserve. Being the investment in an unlisted company, IOR has not carried out the measurement of the fair value. 10.3 Material investment in subsidiaries: financial information A. Subsidiaries entities SGIR S.r.l. 262 596 25,783 3,975 100 1,687 -1 8 869 443 443 443 B. Entities subject to joint control C. Entities subject to significant influence 67 IOR Annual report 2016 Compreh ensive income (3) = (1) + (2) Other income items after taxes (2) Profit (loss) for the year (1) Profit (loss) from groups of assets being disposed after taxes Profit (loss) from current operations after taxes Profit (loss) from current operations before taxes Value adjustmen ts and writebacks on tangible and intangible assets Financial assets Non financial assets Financial liabilities Non financial liabilities Total income Interest margin Cash and cash equivalents ITEM 110 ASSETS -TANGIBLE ASSETS 11.1 Tangible assets in-use: detail of the assets measured at cost 2016 2015 1. Owned assets (a) land (b) buildings (c) furniture 1 14 (d) electronic equipment 115 59 (e) other 11 2. Assets acquired under finance lease (a) land (b) buildings (c) furniture (d) electronic equipment (e) other Total 116 84 11.4 Tangible assets held for investment: detail of the assets measured at fair value 2016 2015 FV FV BV L1 L2 L3 BV L1 L2 L3 1. Owned assets (a) land (b) buildings 2,980 2,980 2,897 2,897 2. Assets acquired under finance lease (a) land (b) buildings Total 2,980 2,980 2,897 2,897 Key: BV = book value, FV = fair value 68 IOR Annual report 2016 11.5 Tangible assets in- use: annual changes Land Buildings Furniture Electronic Other Total equipment A. Opening balance 2,628 4,335 32 6,995 A.1 Net total adjustments (2,614) (4,276) (21) (6,911) A.2 Net opening balance 14 59 11 84 B. Increases: B.1 Purchases 1 113 114 B.2 Capitalised improvement costs B.3 Write-backs B.4 Positive fair value differences recognized in a) Net Equity b) Income Statement B.5 Positive foreign exchange differences B.6 Transfer from investment property B.7 Other changes C. Decreases: C.1 Sales C.2 Depreciation (14) (57) (11) (82) C.3 Impairment losses recognized in: a) Net Equity b) Income Statement C.4 Negative fair value differences recognized in a) Net Equity b) Income Statement C.5 Negative foreign exchange differences C.6 Transfer to: a) investment property b) assets being disposed C.7 Other changes D. Net closing balance 2,629 4,448 32 7,109 D.1 Total net adjustments (2,628) (4,333) (32) (6,993) D.2 Gross closing balance 1 115 116 All tangible assets in-use were measured at cost. 69 IOR Annual report 2016 11.6 Tangible assets held for investment: annual changes Total Land Buildings A. Opening balance 2,897 B. Increases: B.1 Purchases B.2 Capitalised improvement costs B.3 Positive fair value differences 136 B.4 Write-backs B.5 Positive foreign exchange differences B.6 Transfer from tangible assets for functional use B.7 Other changes C. Decreases C.1 Sales C.2 Depreciation (53) C.3 Negative fair value differences C.4 Impairment losses C.5 Negative foreign exchange differences C.6 Transfer to other assets a) tangible assets for functional use b) current assets being disposed C.7 Other changes D. Closing balance 2,980 All the tangible assets held for investment are measured at fair value. The item incudes 5 investment properties received in the past through donations, totaling EUR 3.0m. The item increased from 31 December 2015 due to an increase in fair values. The Institute has surveys performed by a qualified independent expert. As of 31 December 2016, the properties did not generate any rental income. In October 2015, the Institute signed a lease agreement with its subsidiary SGIR for the use of four properties for free. In 2016 SGIR did not receive rental income on these properties. In relation to the fifth property, please note that during the month of December 2016 the IOR took the full ownership. At the same time the Institute has not yet the property of the real estate, due to the completion of some formalities related to the inheritance. 70 IOR Annual report 2016 ITEM 120 ASSETS - INTANGIBLE ASSETS 12.1. Detail by asset 2016 2015 Definite Indefinite Definite Indefinite life life life life A.1. Goodwill A.2. Other intangible assets A.2.1 Assets carried at cost: (a) intangible assets generated internally (b) other assets 1,044 875 A.2.2 Assets carried at fair value (a) intangible assets generated internally (b) other assets Total 1,044 875 Intangible assets consist of software programs and cost incurred to implement them. 12.2 Annual changes Other intangible assets Other intangible generated internally assets: other Goodwill DEF INDEF DEF INDEF Total A. Opening balance 6,229 6,229 A.1 Total net adjustments (5,354) (5,354) A.2 Net opening balance 875 875 B. Increases B.1 Purchases 852 852 B.2 Increases of intangible assets generated internally B.3 Write-backs B.4 Positive fair value differences recognized in - Net Equity - Income Statement B.5 Positive foreign exchange differences B.6 Other changes C. Decreases C.1 Sales C.2 Impairment losses - Depreciation (683) (683) - Write downs recognized in + Net Equity + Income Statement C.3 Negative fair value differences recognized in - Net Equity - Income Statement C.4 Transfer to non-current assets being disposed C.5 Negative foreign exchange differences C.6 Other changes D. Net closing balance 7,081 7,081 D.1 Total net adjustments (6,037) (6,037) E. Gross closing balance 1,044 1,044 71 IOR Annual report 2016 Intangible assets are carried at cost. The IOR does not have internally generated intangible assets. ITEM 150 ASSETS - OTHER ASSETS 15. Other Assets 2016 2015 1.Gold 22,394 22,766 2. Medals and precious coins 10,490 10,437 3. Securities sold not settled 4. Sundry debtors 8,095 7,553 5. Prepayments 980 801 Total 41,959 41,557 Gold is mainly deposited with the U.S. Federal Reserve, while medals and precious coins are kept in the IOR vaults. Gold is carried at the lower of cost and net estimated recoverable amount. Medals and precious coins are appraised on the basis of their weight and the quality of gold and silver they contain, carried at the lower of cost and net estimated recoverable amount. For further information regarding the accounting policies adopted, their impacts and their evaluation, please refer to Part. 1 “Accounting policies” Section 1.1.4 “Other aspects” in these financial statements. Also included in Other Assets is Sundry debtors, for EUR 6.5m, representing commission from asset management services not yet received at the closing date of the financial statements.These commissions, pertaining to the second half of 2016, were collected at the beginning of 2017. Furthermore, other assets include prepayments, which is comprised of EUR 799,000 deposited as guarantees for credit cards transactions and EUR 160,000 in advances for credit cards transactions. 72 IOR Annual report 2016 LIABILITIES ITEM 10 LIABILITIES - DUE TO BANKS 1.1 Detail by product 2016 2015 1. Due to Public Authorities of which: - Public Authorities ex art. 24 (c) 10,597 2. Due to foreign Public Authorities of which: - Public Authorities ex art. 24 (d) 3. Due to banks 3.1 Current accounts and demand deposits 3.2 Fixed-term deposits 3.3 Loans 3.3.1 Reverse repos 3.3.2 Other 3.4 Amounts due under repurchase agreements of own equity instruments 3.5 Other liabilities Total 10,597 Fair value - level 1 10,597 Fair value - level 2 Fair value - level 3 Total fair value – 10,597 Due to banks include amounts due to the Holy See and Vatican City State Public Authorities, the statutory purpose of which is to administer the Holy See’s proprietary assets (at present APSA). Amounts due as of 31 December 2015 was EUR 10.6m comprised solely by debt on demand to APSA. As of 31 December 2016, there were no amounts due to banks. 1.2 Subordinated liabilities There are no subordinated liabilities recognized in this item. 73 IOR Annual report 2016 ITEM 20 LIABILITIES - DUE TO CUSTOMERS 2.1 Detail by type 2016 2015 1. Current accounts and demand deposits 2,397,688 2,319,257 2. Fixed-term deposits 1,236 4,146 3. Loans 3.1 Reverse repos 3.2 Other 4. Amounts due under repurchase agreements of own equity instruments 5. Other payables Total 2,398,924 2,323,403 Fair value - level 1 Fair value - level 2 Fair value - level 3 2,398,924 2,323,403 Total fair value 2,398,924 2,323,403 Due to customers had a slight increase from 2015, recording, on one hand, an increase in the number of accounts and demand deposits, offset by a decrease in fixed-term deposits. The above amounts includeliquidity and term deposits related to the Asset Management agreements, for which IOR is the depository institution. These are comprised of: Deposits related to Asset management accounts 2016 2015 Deposits on demand 417,026 424,815 Time deposits Total 417,026 424,815 The item Due to customers also includes a deposit at the disposal of the Commission of Cardinals to support works of religion. As of the balance sheet date, this amounted to EUR 6.3m (2015: EUR 11.3m). The EUR 5.0m decrease was mainly due to the distribution of funds for charitable activities. 2.2 Subordinated liabilities There are no subordinated liabilities recognized in this item. ITEM 100 LIABILITIES - LEGATES The item includes the deposits of the “Legates” amounting to EUR 47.1m (2015: 48.3m) as of 31 December 2016, comprised of 293 funds (2015: 295) donated to the Institute. The IOR has the burden, for a significant period of time, of fulfilling specific ecclesiastical functions or otherwise achieving purposes related to works of piety, apostolate and charity works, on the basis of its annual income. 74 IOR Annual report 2016 ITEM 110 LIABILITIES - OTHER LIABILITIES Other liabilities 2016 2015 Inheritances to be settled 6,384 7,587 Invoices to be received 4,515 5,161 Outstanding checks 1,070 1,105 Remunerations to be paid 914 966 Other sundry creditors 908 404 Funds for charitable contributions 3,220 3,303 Liabilities for guarantees issued and commitments towards third parties 1,699 1,561 Securities purchased not settled Total 18,710 20,087 The item “Inheritances to be settled” represents the property values of deceased donors pending resolution of inheritance issues. The amount of EUR 1.7m (2015: EUR 1.6m) reported under “Liabilities for guarantees issued and commitments towards third parties” is due to guarantees in addition to the commitments to third parties to lend funds of uncertain use (see paragraph 13.1 Guarantees and commitments). Funds for charitable contributions are comprised of the Fund for Holy Masses and Fund for Missionary Activities. Fund for Missionary Activities The Fund for Missionary Activities is used to distribute contributions to congregations and institutions that operate missionary and charitable activities. It is mainly funded by small donations with a commitment to execute Missionary activities. Donations and distributions are recorded directly into the Fund’s account. Distributions to the beneficiaries are approved by a Committee comprised of the Prelate, the “Aggiunto al Direttore” and the Client Relationship Manager. Fund for Holy Masses The Fund for Holy Masses is used to distribute contributions to priests for Holy Masses. It is financed through small donations with a commitment to the Holy Masses. Donations and distributions are directly recorded into the Fund’s account. Distributions to the priests are approved by a Committee comprised of the Prelate, the “Aggiunto al Direttore” and the Client Relationship Manager. 75 IOR Annual report 2016 The detail of Funds for charitable contributions is as follows: Funds for charitable 2016 2015 A. Fund for Missionary Activities 156 239 1. Balance at 1 January 239 189 2. Donations received 86 145 3. Distributions for Missionary Activities (169) (95) B. Fund for Holy Masses 3,064 3,064 1. Balance at 1 January 3,064 2,971 2. Donations received 83 154 3. Distributions for Holy Masses (83) (61) Total 3,220 3,303 Distributions of funds to beneficiaries are subject to strict internal policies. It should be noted that the charitable activities of the Commission of Cardinals are made through a deposit included in item 20 of the liabilities. ITEM 120 LIABILITIES - STAFF SEVERANCE FUND 10.1 Annual changes 2016 2015 A. Opening balance 6,788 6,551 B. Increases B.1 Allocation for the year 534 530 B.2 Other changes 518 C. Decreases C.1 Benefits paid (624) (84) C.2 Other changes (223) (209) D. Closing balance 6,993 6,788 The Staff severance fund comprises indemnities paid to personnel when they leave the IOR. 76 IOR Annual report 2016 The change in the fund balance is summarised as follows: 2016 2015 Balance at 1 January 6,788 6,551 Current costs 459 457 Contribution by individuals 75 73 Transfers to benefit plan for pensions (223) Advances (80) (84) Advances restitution 148 Consideration paid during the year (544) Actuarial (gain) loss of the year 370 (209) Balance at 31 December 6,993 6,788 The actuarial assumptions used for the valuation of the Staff severance fund are the same as those used for the Benefit Plan Liability for pensions, described in Item 130 (a) Liabilities. As defined by IAS 19, a sensitivity analysis was performed on the variation of the main actuarial assumptions included in the calculation model; these assumptions are: • annual discount rate; • annual rate of salary growth; • annaul inflation rate; • annual mortality rate Annual discount rate Annual rate of salary growth Annual inflation rate Mortality rate Liabilities +0,50 p.p. -0,50 p.p. +0,50 p.p. -0,50 p.p. +0,50 p.p. -0,50 p.p. +0,025 p.p. -0,025 p.p. 6,866 7,127 7,117 6,874 6,992 6,994 6,965 7,008 10.2 Other information Please refer to the paragraphs regarding the accounting policies for more information on the calculation of employee termination indemnities. The portion of employee gross salaries retained by the Institute is 1.5%. No payments were made to the Vatican Pension Plan. Funds were managed by the IOR Treasury department. ITEM 130 LIABILITIES - ALLOWANCES FOR RISKS AND CHARGES 11.1 Detail by type 2016 2015 1. Post employment benefits for pensions 121,088 108,338 2. Other allowances for risks and charges 2.1 legal disputes 2.2 staff expenses 2.3 other 3,500 16,500 Total 124,588 124,838 77 IOR Annual report 2016 11.2 Annual changes Provision for pension and similar obligations Other provisions Total A. Opening balance 108,388 16,500 124,838 B. Increases B.1 Provision for the year 2,731 2,731 B.2 Time value changes B.3 Changes due to discount rate variations 12,905 12,905 B.4 Other changes 223 223 C. Decreases C.1 Utilization in the year (3,109) (13,000) (16,109) C.2 Changes due to discount rate variations C.3 Other changes D. Closing balance 121,088 3,500 124,588 11.3 Pension plan liabilities defined benefit obligations More in detail, the changes in the Plan concern the following items: 2016 2015 Opening balance 108,338 117,396 Current Service cost 607 780 Interest cost 2,031 1,811 Contribution by individuals 93 96 Transfer from staff severance fund 223 Pensions paid during the year (3,109) (3,075) Transfer out Actuarial (gain) loss of the year 12,905 (8,670) Closing balance 121,088 108,338 The actuarial valuation of the defined benefit plan liability was performed using the following assumptions: 2016 2015 Annual inflation rate 2.00% 2.00% Annual discount rate 1.43% 1.93% Annual rate for revaluation of pension 2.00% 2.00% Annual rate of real increase salary 2.35% 2.35% The Current Service Cost is the actuarial present value of benefits due to employees for services rendered during the period. The Interest Cost is the increase in the present value of the obligation from the passage of time and it is proportional to the discount rate used in the assessment of the previous year’s liabilities. The Actuarial gain/loss is the change in the liability in the present year arising from: • the effect of the differences between the previous actuarial assumptions and what has actually occurred; • the effect of the changes in actuarial assumptions. The results are recognized directly to Equity in a specific reserve named “Valuation reserves” “Post- 78 IOR Annual report 2016 employment benefit actuarial gain (loss) reserves” and the actuarial gain or loss is recorded in Other Comprehensive Income. For Staff severance fund and Provisions for pensions and similar obligations, in 2016, the Institute recognized an actuarial loss of EUR 13.3m (2015: gain of EUR 8.9m) in Other Comprehensive Income. Consequently, change in the “Valuation reserves” (item 140 Equity) was a loss of EUR 46.0m (2015: EUR -32.7m); the increased loss compared to the prior year is due to the decrease in the discount rate to 1.43% in 2016 from 1.93% in 2015. A total of 102 employees are active and contribute to the Pension plan (2015:109). A total of 74 former employees are in retirement and benefit from the plan (2015: 70). As defined by IAS 19, a sensitivity analysis was performed on the variation of the main actuarial assumptions included in the calculation model; these assumptions are: • annual discount rate; • annual rate of salary growth; • annaul inflation rate; • annual mortality rate. Annual discount rate Annual rate of salary growth Annual inflation rate Mortality rate Liabilities +0,50 p.p. -0,50 p.p. +0,50 p.p. -0,50 p.p. +0,50 p.p. -0,50 p.p. +0,025 p.p. -0,025 p.p. 110,727 133,037 120,674 119,123 131,768 109,479 120,757 121,407 11.4 Other information Please refer to the paragraphs regarding the accounting policies for more information on the calculation of the pension fund. The portion of employee gross salaries retained by the Institute is 6%. No payments were made to the Vatican Pension Plan. Funds were managed by the IOR Treasury department. 11.5 Other provisions As of 31 December 2016, based on analysis performed with the support of legal consultants, a liability of EUR 3.5m was estimated for potential tax liabilities. The reestimation led to the recognition of EUR 13m in income included in the item 160 Income Statement “Net provisions to risks and charges” corresponding to item 130 Liabilities “Provision for risks and charges” line (b) “Other provisions” of the balance sheet. As the estimate was based on critical assumptions, actual results may differ from what is expected when the future event will take place. The relative content of the item was explained in the paragraph 1.1.4.1 Other aspects - Critical accounting estimates and judgements, Part 1 Accounting policies. 79 IOR Annual report 2016 ITEM 160 170 EQUITY - RESERVES 12.1 Capital Capital, as a separate component of Equity, represents a permanent endowment that cannot be reduced or distributed, except in case of cessation or liquidation of the entity. During 2016, no changes were recorded in Capital balance, amounting to EUR 300m. Securities and liquid funds made up the Capital; in detail, deposits to APSA, other liquid assets, supranational bonds and governative bonds with high quality credit rating. 12.2 Reserves The equity balance is comprised of two different reserves, Available and Unavailable reserves. Unavailable Reserves are earning reserves designed to further strengthen the Institute’s Equity and long-term stability. Available Reserves are earning reserves representing earnings that could potentially fulfill a “stabilization” function, subject to a resolution of the Commission of Cardinals. During 2016, no changes were recognized in Unavailable Reserves, amounting to EUR 100m, and Available Reserves, amounting to EUR 282m. Unavailable reserves are comprised of securities, properties and precious metals. In detail are gold bars, medals and coins, investment in subsidiary (SGIR S.r.l.), real estate properties and liquid financial instruments traded on regulated markets. The Available Reserve is comprised of securities, representing liquid financial instruments traded on regulated markets. 13 ADDITIONAL INFORMATION 13.1 Guarantees and commitments 2016 2015 1) Financial guarantees given a) Banks 27 27 b) Customers 15 41 2) Commercial guarantees given a) Banks b) Customers 3) Irrevocable commitments to lend funds a) Banks b) Customers i) of certain use ii) of uncertain use 4,000 4,000 4) Underlying commitments on credit derivatives: protection sales 5) Assets pledged as collateral of third party commitments 6) Other commitments Total 4,042 4,068 80 IOR Annual report 2016 At the balance sheet date, the Institute has a commitment of EUR 4m of uncertain use issued in favor of third parties. The IOR issued in past three guarantees covered by assets held in custody. No new guarantees were issued in 2016. The guarantees were initially recognized at their nominal value, which is their fair value. In subsequent periods, the guarantees are reported at the amount determined in accordance with IAS 37 “Provisions, Contingent Liabilities and Contingent Assets”. 13.4 Asset Management and Brokerage on behalf of third parties 2016 2015 1. Trading on behalf of customers (a) purchases (i) settled 129,087 (ii) to be settled (b) sales (i) settled 84,530 (ii) to be settled 2. Portfolio management (assets management) (a) individual 3,110,929 3,185,685 (b) collective 3. Custody and administration of securities (a) third party security held in deposit: related to depositary bank activities (excluding portfolio management) (i) security issued by the entity that prepare the financial statement (ii) other securities (b) third party securities held in deposit: other (excluding portfolio management) (i) security issued by the entity that prepare the financial statement (ii) other securities (c) third party securities deposited with third parties 554,763 646,161 (d) proprietary portfolio securities deposited with third parties 2,508,160 2,586,923 4. Other operations Assets under Management agreements are valued using the mark-to-market method. They include the total value of portfolios, and liquid and term deposits. Accruals are also included, both on securities and on liquid and term deposits.The IOR is the depository of liquid and for term deposits, amounting to EUR 417.2m (2015: EUR 424.8m), as disclosed in item 20 Liabilities “Due to customers”. Assets under custody agreements are also valued based on current bid prices, using the mark-to-market method. They also include accruals on interest to be received on debt securities. Due to the change in accounting system, the data for 2015 were too heavy to be extracted and barely relevant in comparison to the information provided. 81 IOR Annual report 2016 PART 3. INFORMATION ON INCOME STATEMENT ITEM 10 INCOME STATEMENT - INTEREST AND SIMILAR INCOME 1.1 Interest income and similar income: detail 2016 2015 Debt Loans Other Total Total securities transactions 1. Financial assets held for trading 22,574 22,574 26,202 2. Financial assets available for sale 3. Financial assets held to maturity 15,217 15,217 16,284 4. Due from banks 135 1,480 1,615 3,844 5. Due from customers 46 380 426 2,311 6. Financial assets carried at fair value 7. Hedging derivatives 8. Other assets Total 37,972 1,860 39,832 48,641 Interest and similar income (other than those recorded in the item Net value adjustments/write backs) accrued during the year in positions classified as impaired at the balance sheet date amounted to EUR 310,000. They were directly deducted from line 5 in the table above. ITEM 20 INCOME STATEMENT - INTEREST AND SIMILAR EXPENSES 1.4 Interest and similar expenses: detail 2016 2015 Payables Securities Other Total Total transactions 1. Due to Public Entities (i) Public Authorities (ii) Foreign Public Authorities (iii) International and Regional Organizations 2. Due to banks (52) (52) (16) 3. Due to customers (3,117) (3,117) (4,987) 4. Outstanding securities 5. Financial liabilities held for trading 6. Financial liabilities designated at fair value through profit and loss 7. Other liabilities and funds 8. Hedging derivatives 9. Due to other subjects Total (3,169) (3,169) (5,003) In 2016 the Institute recorded a general decrease in all items related to interest margin, both income and expense, bringing consequently to a net reduction in the Interest Margin. Interest income decreased due to the impact of lower interest rates determined by the European Central Bank in 2014, 2015 and 2016, and the expiration of many positions with higher interest rates. Interest expense decreased on interest payable on customer deposits (-37%) from the expiration of term deposits with high interest rates. 82 IOR Annual report 2016 ITEM 40 INCOME STATEMENT - FEE AND COMMISSION INCOME 2.1 Fee and commission income: detail 2016 2015 a) Guarantees given/received 1 1 b) Credit derivatives c) Administration, brokerage and consultancy services: 1. trading in financial instruments 654 1,340 2. trading in currencies 3. portfolio management 3.1 individual 12,483 13,667 3.2 collective 4. Custody and administration of securities 113 208 5. Custodian bank 6. Securities placement 7. Receipt and transmission of orders activity 8. Consulting 8.1 investments 8.2 financial structure 9. Distribution of third-party services 9.1 portfolio management 9.1.1 individual 9.1.2 collective 9.2 insurance products 9.3 other products d) collection and payment services 2,196 2,053 e) servicing of securitization operations f) factoring services g) rate and tax collection office services h) multilateral trading systems management i) current account keeping and management 369 400 j) other services 21 41 Total 15,837 17,710 The decrease in Fee and Commission income was due to the general reduction in customer transactions, the decrease in assets under management agreements, and the shift of some high network clients from equity lines to asset management lines (especially bond ones) with lower commission. 2.2 Fee and commission income: distribution channels of products and services All the IOR products and services are offered at IOR locations in Vatican City State. 83 IOR Annual report 2016 ITEM 50 INCOME STATEMENT - FEE AND COMMISSION EXPENSE 2.3 Fee and commission expense: detail 2016 2015 a) Guarantees given/received b) Credit derivatives c) Administration, brokerage and consultancy services: 1. trading in financial instruments (83) (648) 2. trading in currencies 3. portfolio management 3.1 own portfolio 3.2 third-party portfolio 4. Custody and administration of securities (1,613) (913) 5. Placement of financial instruments 6. Sales of financial instrument, products and services through other outlets d) Collection and payment services (761) (921) e) Administration and management of current accounts (571) f) Other services (1) Total (3,029) (2,482) The increase in Fee and commission expense was mainly due to the increase in custody and administration fees for securities (doubled compared with 2015) and fee and commissions charged by correspondent banks on current accounts of the Institute as charges for the management of liquidity. ITEM 70 INCOME STATEMENT - DIVIDENDS AND SIMILAR INCOME 3 Dividends and similar income: detail 2016 2015 Dividends Income Dividends Income from from UCI UCI A. Financial assets held for trading 860 812 686 800 B. Financial assets available for sale 435 468 C. Financial assets carried at fair value through profit and loss D. Investment in subsidiaries Total 1,295 812 1,154 800 Dividends received in 2016 for financial assets held for trading was EUR 1.7m (2015: EUR 1.5m), an increase of 12.5%. In 2016, the Institute received dividends of EUR 435,000 from investment securities recorded as financial assets available for sale (2015: EUR 468,000). 84 IOR Annual report 2016 ITEM 80 INCOME STATEMENT - NET INCOME FROM TRADING ACTIVITIES 4. Net income from trading activities: detail 2016 Gains Profit from Losses Losses from Net trading trading income (A) activities (B) (C) activities (D) [(A+B) - (C+D)] 1. Financial assets held for trading 1.1 Debt securities 6,167 1,429 6,041 1,555 1.2 Equity securities 1,603 1,509 94 1.3 UCI units 1,693 14,445 (12,752) 1.4 Loans 1.5 Other 126 126 2. Financial liabilities held for trading 2.1 Debt securities 2.2 Payables 2.3 Other 3. Financial assets and liabilities: exchange differences 1,529 470 5 1,994 4. Derivatives 4.1 Financial derivatives - On debt securities and interest rates - On equity securities and stock indices - On currencies and gold - Other 4.2 Credit derivatives Total 10,992 2,025 (22,000) (8,983) 2015 Gains Profit from Losses Losses from Net trading trading income (A) activities (B) (C) activities (D) [(A+B) - (C+D)] 1. Financial assets held for trading 1.1 Debt securities 2,467 8,698 11,632 16,670 (17,137) 1.2 Equity securities 2,330 2,604 1,873 3,368 (307) 1.3 UCI units 63 104 18 149 1.4 Loans 1.5 Other 18 18 2. Financial liabilities held for trading 2.1 Debt securities 2.2 Payables 2.3 Other 3. Financial assets and liabilities: exchange differences 24 2,727 236 617 1,899 4. Derivatives 4.1 Financial derivatives - On debt securities and interest rates - On equity securities and stock indices - On currencies and gold - Other 4.2 Credit derivatives Total 4,884 14,133 13,741 20,673 (15,378) 85 IOR Annual report 2016 Below is a summary of the net trading results in 2016 compared to 2015. In 2016, debt securities recognized a gain of EUR 1.6m from a loss of EUR 17.1m in 2015. Realized gain from trading activity was EUR 1.4m compared to a loss of EUR 8.0m in 2015, and the unrealized gain was EUR 120,000 compared to a loss of EUR 9.1m in 2015. In 2016, equity securities recognized a gain of EUR 94,000 from a loss of EUR 307,000 in 2015. No realized profit (loss) was recognized compared to a loss of EUR 764,000 in 2015, while unrealized gain (loss) was EUR 94,000, compared to EUR 457,000 in 2015. In 2016, UCI units recognized a loss of EUR 12.8m from a gain in 2015 of EUR 149,000. No realized gain was recorded in 2016 compared to a gain of EUR 86,000 in 2015, while unrealized loss was EUR 12.8m compared to an unrealized gain of EUR 63,000 in 2015. Line 1.5 “Financial assets held for trading: other” includes gains (losses) from currency trade, gold and other precious metals, recognizing a gain of EUR 126,000 in 2016 from EUR 18,000 in 2015 (realized). “Financial assets and liabilities: exchange differences” recognized a gain of EUR 2.0m from a profit of EUR 1.9m in 2015, comprised of EUR 470,00 realized profit in 2016 compared to EUR 2.1m in 2015 and unrealized profit of EUR 1.5m in 2016 compared to unrealized loss of (EUR 212,000) in 2015. ITEM 100 INCOME STATEMENT - PROFIT (LOSS) ON DISPOSAL OR REPURCHASE 6. Profit (loss) on disposal or repurchase: detail Voci/Componenti reddituali 2016 2015 Profit Losses Net Profit Losses Net income income Financial assets 1. Due from banks 2. Due from customers 3. Financial assets available for sale 3.1 Debt securities 3.2 Equity securities 1.518 (19) 1.499 3.3 UCI units 3.4 Loans 4. Financial assets held to maturity Total assets 1.518 (19) 1.499 Financial liabilities 1. Due to banks 2. Due to customers 3. Outstanding securities Total liabilities 86 IOR Annual report 2016 ITEM 130 INCOME STATEMENT - NET LOSSES/REVERSAL ON IMPAIRMENT 8.1 Net impairment losses on loans: detail Value adjustments (1) Write-backs (2) Specific Specific Portfolio 2016 2015 Derecognition Other Portfolio ABAB (1)+(2) 1. Due from banks - Loans - Debt securities 2. Due from customers Purchased impaired loans - Loans - Debt securities Other receivables - Loans (1,453) 350 58 (1,045) 353 - Debt securities Total (1,453) 350 58 (1,045) 353 8.2 Net impairment losses on financial assets available for sale: detail Value adjustments (1) Write-backs (2) Specific Specific 2016 2015 Derecognition Other A B (1)+(2) 1. Debt securities 2. Equity securities (148) (148) 3. UCI units 4. Loans to banks 5. Loans to customers Total (148) (148) 8.4 Net impairment losses on other financial assets: detail Value adjustments (1) Write-backs (2) Specific Specific Portfolio 2016 2015 Derecognition Other Portfolio ABAB (1)+(2) 1. Guarantees given (138) (138) (156) 2. Credit derivatives 3. Commitments to lend funds 4. Other operations Total (138) (138) (156) 87 IOR Annual report 2016 ITEM 150 INCOME STATEMENT - ADMINISTRATIVE EXPENSES 9.1 Personnel expenses: detail 2016 2015 A. Staff 1. Wages and salaries (5,078) (5,534) 2. Social security charges 3. Termination indemnities 4. Supplementary benefits (630) (658) 5. Provisions for termination indemnities (459) (457) 6. Provisions for post employment benefits (a) defined contribution plans (b) defined benefit plans (2,638) (2,591) 7. Payments to external pension plans (a) defined contribution plans (b) defined benefit plans 8. Other benefits in favor of employees (546) (889) B. Current Personnel with contracts pursuant to ex art. 10 (1) 1. letter (b) 2. letter (c) 3. letter (d) C. Fees and charges for: 1. Board of Superintendence (504) (796) 2. Directorate (299) (241) 3. Revisori (91) (101) D. Early retirement cost E. Recovery of expenses for employees seconded to other entities F. Reimbursement of expenses for employees of the institutions and organizations of the Holy See and the Vatican City State placed at the Institute Total (10,245) (11,267) 9.2 Average number of employees by categories Type Total Managers Officials Staff Average number 104 2 5 97 Reimbursement of expenses for employees of the institutions and organizations of the Holy See and the Vatican City State placed at the Institute. 9.3 Post employment defined benefit plans: costs and revenues Post employment defined benefit plans: costs 2016 2015 Current Service cost of internal Pension Plan 607 780 Interest cost of internal Pension Plan 2,031 1,811 Post employment costs: contribution to Vatican Pension Plan 630 658 Total Costs 3,268 3,249 Post employment defined benefit plans: revenues Total 3,268 3,249 88 IOR Annual report 2016 9.5 Professional service expenses: detail 2016 2015 A. Professional services expenses 1. Legal services (2,437) (4,552) 2. Directional consultants (718) (1,438) 3. Technical consultants (288) (301) 4. Operational consultants (342) (1,132) 5. Translational services (56) (41) B. Expenses related to works contract 1. ex art. 10 (1) (a) 2. ex art. 11 (1) C. Expenses related to outsourcing contracts D. Expenses related to external auditors (121) (143) Total (3,962) (7,607) 9.6 Other administrative expenses: detail 2016 2015 1. Software maintenances (1,441) (1,247) 2. Other maintenances (800) (592) 3. Local rent (1,000) (1,000) 4. Information providers (379) (483) 5. AIF contribution (346) (230) 6. Other expenses (913) (1,000) Total (4,879) (4,552) ITEM 160 INCOME STATEMENT - NET PROVISION FOR RISKS AND CHARGES Detailed information is provided in Item 130 (b) Liabilities. 89 IOR Annual report 2016 ITEM 170 INCOME STATEMENT - NET VALUE ADJUSTMENTS TO/RECOVERIES ON TANGIBLE ASSETS 11. Net value adjustments to/recoveries on tangible assets: detail 2016 Depreciation Impairment Recoveries Net losses income (a) (b) (c) (a+b-c) A. Tangible assets A.1 Owned assets - Functional use (83) (83) - For investment A.2 Acquired under finance lease - Functional use - For investment Total (83) (83) 2015 Depreciation Impairment Recoveries Net losses income (a) (b) (c) (a+b-c) A. Tangible assets A.1 Owned assets - Functional use (64) (64) - For investment A.2 Acquired under finance lease - Functional use - For investment Total (64) (64) ITEM 180 INCOME STATEMENT - NET VALUE ADJUSTMENTS TO/RECOVERIES ON INTANGIBLE ASSETS 12. Net value adjustments to/recoveries on intangible assets: detail 2016 Amortization Impairment Recoveries Net losses income (a) (b) (c) (a+b-c) A. Intangible assets A.1 Owned assets - Generated internally by the Institute - Other (683) (683) A.2 Acquired under finance lease Total (683) (683) 2015 Amortization Impairment Recoveries Net losses income (a) (b) (c) (a+b-c) A. Intangible assets A.1 Owned assets - Generated internally by the Institute - Other (512) (512) A.2 Acquired under finance lease Total (512) (512) 90 IOR Annual report 2016 ITEM 190 INCOME STATEMENT – OTHER OPERATING INCOME (EXPENSE) 13.1 Other operating income (expense): detail 2016 2015 A. Income 736 13,720 Extraordinary income 558 120 Recovery of amounts for gold and precious metals 178 Closure of past years issue 13,600 B. Expenses (729) (3,231) 1. Operating losses (715) (54) 2. Extraordinary expenses (14) (324) 3. Impairment of amounts for gold and precious metals (2,853) Total 7 10,489 ITEM 220 INCOME STATEMENT – NET RESULT OF FAIR VALUE VALUATION OF TANGIBLE AND INTANGIBLE ASSETS 15. Net result of fair value valuation of tangible and intangible assets: detail Exchange differences 2016 Revaluations Impairment Positive Negative Net income (a) (b) (c) (d) (a-b+c-d) A. Tangible assets A.1 Owned assets - Functional use - Held for investment 136 (53) 83 A.2 Acquired under finance lease - Functional use - Held for investment B. Intangible assets B.1 Owned assets B.1.1 Generated internally by the Institute B.1.2 Other B.2 Acquired under finance lease Total 136 (53) 83 Exchange differences 2015 Revaluations Impairment Positive Negative Net income (a) (b) (c) (d) (a-b+c-d) A. Tangible assets A.1 Owned assets - Functional use - Held for investment 517 (16) 501 A.2 Acquired under finance lease - Functional use - Held for investment B. Intangible assets B.1 Owned assets B.1.1 Generated internally by the Institute B.1.2 Other B.2 Acquired under finance lease Total 517 (16) 501 91 IOR Annual report 2016 PART 4. INFORMATION ON COMPREHENSIVE INCOME 2016 Gross Income Net amount tax amount 10. Profit (loss) for the year 36,001 36,001 Other comprehensive income that may not be reclassified to the income statement 20. Tangible assets 30. Intangible assets 40. Defined benefit plans (13,275) (13,275) 50. Non current assets held for sale 60. Share of valuation reserves connected with investments carried at equity Other comprehensive income that may be reclassified to the income statement 70. Hedges of foreign investment (a) fair value changes (b) reclassification to the income statement (c) other changes 80. Foreign exchange differences (a) fair value changes (b) reclassification to the income statement (c) other changes 90. Cash flow hedges (a) fair value changes (b) reclassification to the income statement (c) other changes 100. Financial assets available for sale (a) fair value changes (1,838) (1,838) (b) reclassification to the income statement - impairment losses 148 148 - gains (losses) from disposals (2,589) (2,589) (c) other changes 110. Non current assets held for sale (a) fair value changes (b) reclassification to the income statement (c) other changes 120. Share of valuation reserves connected with investments carried at equity: (a) fair value changes (b) reclassification to the income statement - impairment losses - gains (losses) from disposals (c) other changes 130. Total other comprehensive income (17,554) (17,554) Total Comprehensive Income (item 10 + item 130) 18,447 18,447 92 IOR Annual report 2016 2015 Gross Income Net amount tax amount 10. Profit (loss) for the year 16,127 16,127 Other comprehensive income that may not be reclassified to the income statement 20. Tangible assets 30. Intangible assets 40. Defined benefit plans 8,880 8,880 50. Non current assets held for sale 60. Share of valuation reserves connected with investments carried at equity Other comprehensive income that may be reclassified to the income statement 70. Hedges of foreign investment (a) fair value changes (b) reclassification to the income statement (c) other changes 80. Foreign exchange differences (a) fair value changes (b) reclassification to the income statement (c) other changes 90. Cash flow hedges (a) fair value changes (b) reclassification to the income statement (c) other changes 100. Financial assets available for sale (a) fair value changes 4,777 4,777 (b) reclassification to the income statement - impairment losses - gains (losses) from disposals (c) other changes 110. Non current assets held for sale (a) fair value changes (b) reclassification to the income statement (c) other changes 120. Share of valuation reserves connected with investments carried at equity: (a) fair value changes (b) reclassification to the income statement - impairment losses - gains (losses) from disposals (c) other changes 130. Total other comprehensive income 13,657 13,657 Total Comprehensive Income (item 10 + item 130) 29,784 29,784 93 IOR Annual report 2016 ATTACHMENTS A.1 Disclosure concerning the fees of the independent auditors and services other than auditing During 2016, the IOR did not pay fees to the companies belonging to the network of the audit firm Deloitte & Touche S.p.A. with the exception of those related to the audit of the annual accounts amounting to EUR 121. The fees due are those contractually agreed, inclusive of any indexation and reimbursement of expenses calculated as a forfeit. Fees do not include out-of-pocket expenses or taxes. A.2 Exchange rates as of the balance sheet date The balances at year-end, denominated in foreign currencies, are measured at the exchange rates observed by the European Central Bank on the last working day of the year (in 2016: 30 December). For the other currencies, the rates used are those provided by infoproviders on the same date. For the 2016 financial statements, the rates were determined as follows: Currency 2016 2015 U.S. Dollars USD 1.0541 1.0926 Swiss Francs CHF 1.0739 1.0814 Canadian Dollars CAD 1.4188 1.5171 English Pounds GBP 0.8562 0.7380 Australian Dollars AUD 1.4596 1.4990 Japanese Yen JPY 123.40 131.66 Czech Crowns CZK 27.0210 27.029 Danish Crowns DKK 7.4344 7.4625 Hungarian Forints HUF 309.83 313.15 Norwegian Crowns NOK 9.0863 9.6160 Polish Zloty PLZ 4.4103 4.2400 Swedish Crowns SEK 9.5525 9.1878 Brazilian Reais BRE 3.4305 4.2590 South African Rand ZAR 14.4570 16.8847 Hong Kong Dollars HKD 8.1751 8.4685 South Korean Won KRW 1,224.94 1,284.79 Singapore Dollars SGD 1.5234 1.5449 New Zealand Dollars NZD 1.5158 1.5959 A.3 Date of authorisation for issue The financial statements were presented and authorised for issuance by the Directorate on 27 March 2017 and approved by the Board of Superintendence on 26 April 2017. 94 IOR Annual report 2016 PART 5. INFORMATION ON RISKS AND HEDGING POLICIES 5.1 Introduction The Institute’s policies and procedures for the management and monitoring of risks arising from investments decisions, are summarized in the following paragraphs, with a focus on the parties involved and their responsibilities. The Institute considers it appropriate: a) to assign risk measurement functions and risk integrated control to a specific department, headed by the Risk Management department; b) to assign the functions dedicated to the definition of operating limits, the authorization of possible overruns or payment requests within assigned limits, to the appropriate Risk Committee. Other bodies of the Institute are involved and assigned with different tasks in risk management and monitoring, such as the Board of Superintendence, Directorate, Internal Audit department, Treasury department, Compliance. This structure is based on the rules and the requirements provided by the Financial Information Authority (AIF) for a compliant internal audit system, as defined by Regulation No.1/2015 on “Prudential Supervision of Entities Carrying out financial activities on a professional basis (“Regolamento n.1”), implementing Title III of the Law introducing norms of “Transparency, Supervision and Financial Intelligence” no. XVIII issued on 8 October 2013 (“Law no. XVIII”). The Risk Management function is an independent structure from the risk-taking functions, reporting directly to the Directorate and with functional reporting also to the Board of Superintendence. The following paragraphs set out the rules of the different organizational structures and the governing bodies involved in the monitoring and managingement of risks. 5.1.1 Duties and responsibilities of bodies involved The Institute bodies involved in various capacities in the management and monitoring of risk relating to investment decisions are the following: • Board of Superintendence; • Directorate; • Risk Committee; • Risk Management Department; • Compliance Department; • Internal Audit Department; • Head of Treasury Department; • Investment Committee. 5.1.1.1 Board of Superintendence The Board of Superintendence is responsible for defining the strategic guidelines and general policies for risk management. The Board of Superintendence can request the Directorate to update the guidelines for the measurement and assessment of risks. 5.1.1.2 Directorate The Directorate establishes, the overall strategies, general policies and guidelines set forth by the Board of Superintendence and any amendments thereto, the risk management and monitoring 95 IOR Annual report 2016 methodologies and their implementation and integration proposed by the Risk Committee, and the general structure of market and credit operational limits (counterparty risk and issuer risk). The Directorate also establishes periodically, based on the proposal of the Risk Committee, the limits granted to new trading partners. The Directorate monitors the risk exposure on a daily basis, through reports produced by the Risk Management department, and is informed promptly by the department when operational limits have been exceeded and can request an emergency meeting of the Risk Committee. When operational limits are exceeded, based on a proposal from the Risk Committee, the Directorate determines the way in which the overrun may be managed: a) The Directorate can authorize the overrun specifying the period for which the authorization is granted; b) The Directorate can ask the head of the operating area involved for a recovery plan to be established. The Directorate then authorizes the plan, or can ask for recovery in different ways and/or in different periods than the recovery period proposed. 5.1.1.3 Risk Committee A Risk Committee has been established by the Directorate and chaired by Head of Risk Management department with the aim: • to propose a Risk Appetite Framework and management and control methodologies and all subsequent amendments thereof, in compliance with the general limits set up by RAF; • to propose to the Directorate the general structure of market and credit operational limits (counterparty risk and issuer risk); • to propose periodically to the Directorate credit limits granted to the new trading partners, within the general limits defined in the RAF; • to periodically review the Institute’s risk trend, with specific focus on the most relevant events or those with the greatest impact; • in case of an emergency meeting, where operational limits have been exceeded, to express an opinion to the Directorate on the authorization for exceeding limits, or on the recovery plan arrangements. The organizational aspects of the Risk Committee are disclosed in an appropriate regulation. 5.1.1.4 Risk Management Department The Institute’s Risk Management department: • presents to the Risk Committee issues related to the Institute’s exposure to market, credit, liquidity, operational and reputational risks, proposing methodologies, instruments and processes for the management of those risks; • is responsible for the implementation, validation and maintenance of an adequate risk exposure control system and its performance; • on a daily basis, observes the market, credit and liquidity risks and trading activity performance, preparing specific reports for the Board, the Directorate and the head of Treasury Department; • monitors the compliance with the risk indicators outlined in the Risk Appetite Framework (RAF) approved by the Board of Superintendence, preparing specific reports; • monitors the adherence to operational limits in the Institute’s trading activity, promptly informing the Directorate and the head of Treasury Department of any overruns. When limits are exceeded, it can request an emergency meeting of the Risk Committee; • calculates capital requirements in compliance with legal requirements. 96 IOR Annual report 2016 5.1.1.5 Compliance Department The IOR Compliance Department, in accordance with AIF Regulation No. 1, oversees, using a riskbased approach, management of the risk of non-compliance in corporate activity, ensuring that internal procedures are suitable to prevent such risk. In particular, it is responsible for managing the risk of non-compliance with the most important regulations, such as those relating to financial activity and brokerage, anti-money laundering, and management of conflicts of interest, ensuring that the internal procedures are suitable to mitigate these risks. As regulated by Article 29 of Regulation No. 1, in order to achieve its mission, the Compliance Department: • remains current on the rules applicable to the Institute and its activities and measures/assesses the impact of any changes on existing processes and internal procedures; • verifies compliance with external regulatory requirements and self-regulation; • proposes organizational and procedural changes that ensure adequate supervision of the risk of non-compliance with identified rules; • monitors effectiveness of the suggested organizational changes for prevention of the risk of noncompliance; • prepares direct information flows for the Institute’s governance bodies and for the other concerned functions/structures; • provides advice and assistance to the Institute’s governance bodies for all matters in which the non-compliance risk is relevant as well as collaboration in training personnel on the provisions applicable to their activities. 5.1.1.6 Internal Audit Department The Institute’s Internal Audit department verifies through the audit plan: • the adherence to risk management procedures as established by the Board of Superintendence and by the Directorate, based on a proposal from the Risk Committee; • the adequacy of the risk monitoring tools and procedures related to the Institute’s investment decisions. 5.1.1.7 Head of Treasury Department • Defines the operating investment decisions to be made on financial markets, ensuring consistency with the strategic goals and predetermined limits. • Requests revisions to the assigned operational limits, or the authorization to engage with new counterparties, subject to the review of the Risk Committee. • Defines, within the limits of the authority granted, the necessary corrective actions to restore the defined risk/return profile. 5.1.2 Risk culture and further developments The Institute is involved in a complete overhaul of its current financial, credit, liquidity, reputational and operational risks management programs.This involves the strengthening of the Risk Management department through the acquisition of new skills, the revision of the integrated system of risk measurement and the development of specific frameworks for the management of reputational and operational risks. The approval of a Risk Appetite Framework integrated in the activities of daily risk management 97 IOR Annual report 2016 allows for the development and dissemination of a risk culture, particularly in the functions dedicated to the management of financial risks, which are the main source of risk. The development and implementation of framework dedicated to reputational and operational risks, as well as the focus on the risks of non-compliance, will allow even stronger risk culture across the Institute.These actions, together with the controls already in place on anti-money laundering and combating the financing of terrorism, will complete the system of risk management and monitoring of the Institute. 5.2 Credit risk Format and content of information on credit risk and related hedging policies. 5.2.1 General aspects Credit risk rises from the possibility that counterparties may not honour their commitments. Depending on the nature of those commitments, the Institute’s credit risk may be divided in two categories: a) credit risk arising from the Institute’s trading activity for their own account and on behalf of its clients. Credit risk represents the risk that a counterparty may not fulfill its contractual obligations related to a transaction concerning financial instruments. This risk may be classified into three categories: 1. cash risk (e.g. deposits); 2. issuer risk (e.g. bond purchases); 3. counterparty risk, mainly generated by the operations in Delivery versus Payment (e.g. term operations, repos). b) credit risk arising from loans to customers, classified in the financial statements as “Due from customers”; within this risk category, the Institute considers it appropriate not to measure this risk because: • the item is not material when compared to total assets; • the exposure is limited to Catholic congregations and Vatican employees, both of which have low risk categories by their nature; • credits are usually accompanied by guarantees: securities, asset management or, for the Institute employees, post employment benefits. It is to be mentioned that the Institute is not authorized by the Autorità di Informazione Finanziaria to carry out the activity of “lending” (cfr. art. l (l) (b) of the Law n.XVIII and art. 3 (24) (b) of the Regulation No. l), as credit activities on its own. However, it is authorized to make “advances” that is to disburse funds to its clients and to a limited extent following guarantee of future income (such as, for example, in the case of the advance of salary or pension paid by the Holy See or the Governatorato of Vatican City) or guaranteed by financial assets of the same amount deposited by the clients at the Institute. In general, the main credit risks associated with investment in securities, mainly issued by government entities and bank deposits. Considering the overall interest rates and returns offered, the strategy during 2016 was to focus mainly on issuers and purchases with high returns, considering implicit risks, giving preference to Eurozone government issuers with BBB rating and increasing purchases in USD currency. At the end of 2016, the bond securities portfolio amounted to EUR 2.4bn with an average duration of 1.37 years and high credit standing (99.6% investment grade). The bond securities portfolio is mainly comprised of Italian and Spanish government bonds (45.57% of the total) and bank securities (23.18% of the total). 98 IOR Annual report 2016 Additional details on the bond portfolio composition are provided in the next paragraphs. 5.2.2 Credit risk management policies 5.2.2.1 Organizational aspects The Treasury Department is responsible for the management and monitoring of credit risks over trading activity and collections of amounts due from clients. The Treasury Department is qualified to assume credit risk in compliance with operational limits. Particularly, the process of risk assumption involves the following: • the Director General, delegates the assumption of credit risks to the Treasury Department, within predetermined by amount, type and counterparty; • the Treasury Department, assumes credit risk in its operations in compliance with its defined limits.The assumption of credit risk for amounts greater than the predetermined limit assigned to the department requires the authorisation of the Director General; • the Risk Committee, supporting the Director General in establishing a system ofcredit risk management and monitoring, the definition of operational limits, the analysis of any overruns and in evaluating authorisations of limits exceeded; • the Risk Management Department, daily monitors compliance with operational limits, promptly reporting to the Directorate any unauthorized overruns. 5.2.2.2 Management, measurement and control systems Credit risk monitoring activity is delegated to the Risk Management Department, applying the Institute’s specific-methodology, validated by the Risk Committee and approved by the Director General. This methodology provides, in particular, for the definition of: • a set of determined counterparties with which the Treasury department is allowed to engage with. For each counterparty, the type of risk that the Institute can assume and the maximum amount of exposure are defined; • credit risk quantification criteria for each financial instrument, distinguishing between counterpart risk, issuer risk and cash risk; • add-on quantification criteria to be applied to all contracts with future settlement, diversified by maturity and margining practices. Concerning the maximum amount of exposure to each counterparty, the methodology provides for the use of an internal rating, defined by the characteristics of the counterparty, the rating from International Rating Agencies (Moody’s, S&P, Fitch) and credit spread level quoted in the market (spread on Credit Default Swaps). The use of the credit default swaps spread enables prompt updating of the internal rating and their credit maximum exposure when the market shows signs of difficulties with a determined issuer before these difficulties can lead to a change of the counterparty’s rating. In addition to the limits defined above, the Board of Superintendence defined other limits at trading portfolio level based on a sensitivity spread, distinguishing between government and corporate issuer. The impact of this stress test at the closing date of this financial statements amounting respectively to EUR 18.9m and EUR 18.2m. 5.2.2.3 Credit risk mitigation techniques Currently, the Institute has no offsetting agreements in place with financial counterparties and does not operate in the credit derivatives market. 99 IOR Annual report 2016 5.2.2.4 Non-performing financial assets For amounts due from clients, an internal monitoring system assists the Directorate to determinine if there is objective evidence of the impairment of loans, based on the following criteria established by the Institute: • default in contractual payments of both capital and interest; • delays in payments due to liquidity problems of customers; • deterioration in the value of the guarantees provided. The IOR has also issued guarantees requested by customers covered by assets held in custody, which are disclosed on paragraph 13.1 Part 3. 5.2.3 Credit quality As disclosed in AIF Circular, the use of the term “credit exposures” excludes equity securities and UCI units. The use of the term “exposures” includes equity securities and UCI units. 1 Performing and non-performing credit exposures: amounts, adjustments, changes, economic and geographical detail 1.1 Detail of credit exposures by portfolio classification and credit quality (book values) Bad loans Unlikely Non performing Performing Other to pay past due past due performing Total exposures exposures exposures 1. Financial assets available for sale 2. Financial assets held to maturity 558,956 558,956 3. Due from banks 643,229 643,229 4. Due from customers 7,469 764 71 20,848 29,152 5. Financial assets carried at fair value 6. Financial assets being disposed Total 2016 7,469 764 71 1,223,033 1,231,337 Total 2015 7,718 2,278 681 1,334,464 1,345,141 Note: There are no forborne exposures. The amount of past due exposures (EUR 71,000) has remained the same for more than 1 year. Based on the analysis of debtors at the balance sheet date, there was no objective evidence of potential insolvency of the customer and no impairment loss was recognized. 1.2 Detail of credit exposures by portfolio classification and credit quality (gross and net values) Non-performing assets Performing assets Gross Individual Net Gross Collective Net Total exposure adjustments exposure exposure adjustments exposure (net exposure) 1. Financial assets available for sale 2. Financial assets held to maturity 558,956 558,956 558,956 3. Due from banks 643,229 643,229 643,229 4. Due from customers 24,842 (16,609) 8,233 21,541 (622) 20,919 29,152 5. Financial assets carried at fair value 6. Financial assets being disposed Total 2016 24,842 (16,609) 8,233 1,223,726 (622) 1,223,104 1,231,337 Total 2015 25,344 (15,348) 9,996 1,335,825 (680) 1,335,145 1,345,141 100 IOR Annual report 2016 Assets of evidently low credit Other assets Cumulated capital losses Net exposure Net exposure 1. Financial assets held for trading 1,831,693 2. Hedging derivatives Total 2016 1,831,693 Total 2015 1,563,528 1.3 On- and off-balance sheet credit exposures to banks: gross and net values and past due brackets Type of exposure/value Gross exposure Non-performing assets Up to 3 3-6 6-12 Over Performing Individual Collective Net months months months 1 year assets adjust- adjust- exposure ments ments A. On balance sheet exposures a) Bad loans - of which: forborne exposures b) Unlikely to pay - of which: forborne exposures c) Non-performing past due exposures - of which: forborne exposures d) Performing past due exposures - of which: forborne exposures e) Other performing exposures 1,197,481 1,197,481 - of which: forborne exposures Total A 1,197,481 1,197,481 B. Off-balance sheet exposure a) Non performing b) Performing Total B Total A + B 1,197,481 1,197,481 On-balance sheet exposures include all on-balance sheet financial assets claimed from banks, irrespective of their portfolio of allocation. 101 IOR Annual report 2016 1.7 On- and off-balance sheet credit exposures to customers: gross and net values and aging Type of exposure/value Gross exposure Non-performing assets Up to 3 3-6 6-12 Over Performing Individual Collective Net months months months 1 year assets adjust- adjust- exposure ments ments A. On balance sheet exposures a) Bad loans 9,876 (9,876) - of which: forborne exposures b) Unlikely to pay 12,098 (4,629) 7,469 - of which: forborne exposures c) Non-performing past due exposures 2,868 (2,104) 764 - of which: forborne exposures d) Performing past due exposures 76 (5) 71 - of which: forborne exposures e) Other performing exposures 1,857,863 (617) 1,857,246 - of which: forborne exposures Total A 24,842 1,857,939 (16,609) (622) 1,865,550 B. Off balance sheet exposure a) Non performing b) Other 42 42 Total B Total A + B 24,842 1,857,981 (16,609) (622) 1,865,592 On-balance sheet exposures include all on-balance sheet financial assets claimed from customers, irrespective of their portfolio of allocation. 1.8 On-balance sheet credit exposures to customers: changes in gross non-performing exposures Bad loans Unlikely Non-performing to pay past due exposures A. Initial gross exposures 6,853 12,500 5,991 - of which: exposures sold not derecognised B. Increases B.1 inflows from performing exposures B.2 transfers from other non-performing exposure categories 3,090 B.3 other increases 178 72 C. Decreases C.1 outflows toward performing exposures C.2 write-offs C.3 repayments (245) (402) (105) C.4 credit disposals C.5 losses from disposals C.6 transfers to other non-performing exposure categories (3,090) C.7 other decreases D. Final gross exposures 9,876 12,098 2,868 - of which: exposures sold not derecognised 102 IOR Annual report 2016 1.10 On-balance sheet non performing credit exposures to customers: changes in total adjustments Reason / Categories Bad loans Unlikely to pay Non performing past due exposures Total of which: Total of which Total of which forborne forborne forborne exposures exposures exposures A. Initial total adjustments 6,853 4,782 3,713 - of which: exposures sold not derecognised B. Increases B.1 impairment losses 762 691 B.2 losses on disposal B.3 transfers from other non performing exposure categories 2,290 B.4 other increases 258 53 C. Decreases C.1 recoveries on impairment losses (153) C.2 recoveries on repayments (287) (63) C.3 profits on disposal C.4 write-offs C.5 transfers to other non-performing exposure categories C.6 other decreases (2,290) D. Final total adjustments 9,876 4,629 2,104 - of which: exposures sold not derecognised 2 Classification of exposures based on external and internal ratings 2.1 Detail off and on-balance sheet credit exposures by external rating class Exposures External rating classes Class 1 Class 2 Class 3 Class 4 Class 5 Class 6 Unrated Total A. On balance sheet exposures 623,780 697,578 1,588,979 10,277 20,873 121,544 3,063,031 B. Derivatives B.1 Financial derivatives B.2 Credit derivatives C. Guarantees given 42 42 D. Commitments to lend funds E. Other Total 623,780 697,578 1,588,979 10,277 20,873 121,586 3,063,073 For the analysis of the credit risk of the borrowers / guarantors, the Institute use S&P rating; when S&P are not available, the Institute utilizes the equivalent value from the Moody’s rating agency. In the preparation of the above table S&P ratings have been used. Below a reconciliation between risk classes and the S&P ratings: Class 1 – from AAA to AAClass 2 – from A+ to AClass 3 – from BBB+ to BBBClass 4 – from BB+ to BBClass 5 – from B+ to BClass 6 – Others 103 IOR Annual report 2016 3 Detail of guaranteed credit exposures by type of guarantee 3.2 Guaranteed credit exposures to customers 1.Guaranteed on balance sheet credit exposures 1.1 totally guaranteed 451 451 451 - of which non performing 1.2 Partly guaranteed - of which non performing 2. Guaranteed off-balance sheet credit exposures 2.1 Totally guaranteed - of which non performing Partly guaranteed - of which non performing 104 IOR Annual report 2016 Total (1)+(2) Other entities Banks Other Public Entities Governments and Central Banks Other entities Banks Other Public Entities Governments and Central Banks Credit Linked Notes Other real guarantees Securities Real estate assets - financial lease Real estate assets - mortgages Net exposure Real collateral (1) Guarantees (2) Credit derivatives Other derivatives Credit commitments 5.2.4 Distribution and concentration of credit exposures 1. Detail by sector of on-balance and off-balance sheet credit exposures to customers (book value) Due to the change in accounting system, the data for 2015 were too heavy to be extracted and barely relevant in comparison to the information provided. 105 IOR Annual report 2016 A. On balance sheet exposures A.1 Bad loans 9,876 - of which forborne exposures A.2 Unlikely to pay 7,469 4,629 - of which forborne exposures A.3 Non-performing past due exposures 764 2,104 - of which forborne exposures A.4 Performing exposures 8,290 1,354,046 237,021 9,286 239,360 9,315 622 - of which forborne exposures TOTAL A 8,290 1,354,046 237,021 9,286 239,360 17,548 16,609 622 B. Off-balance sheet exposures B.1 Bad loans B.2 Unlikely to pay B.3 Other non-performing assets B.4 Other exposures 42 TOTAL B 42 TOTAL (A+B) 2016 8,290 1,354,046 237,021 9,286 239,360 17,590 16,609 622 TOTAL (A+B) 2015 Net exposure Individual adjustments Portfolio adjustments Net exposure Individual adjustments Portfolio adjustments Net exposure Individual adjustments Portfolio adjustments Net exposure Individual adjustments Portfolio adjustments Net exposure Individual adjustments Portfolio adjustments Net exposure Individual adjustments Portfolio adjustments Net exposure Individual adjustments Portfolio adjustments Net exposure Individual adjustments Portfolio adjustments Net exposure Individual adjustments Portfolio adjustments Public Authorities Domestic Foreign Public Sector Foreign Private Sector Foreign Public Authorities Regional - Local Public Authorities International Public Authorities Other Public Entities Financial companies Insurance companies Non financial companies Other companies 2. Detail by geographical area of on- and off-balance sheet credit exposures to customers (book value) Exposures / Geographical areas Domestic European Countries America Asia Rest of the world Net Total Net Total Net Total Net Total Net e Total exposure adjustments exposure adjustments exposure adjustments exposure adjustments exposure adjustments A. On balance sheet exposures A.1 Bad loans 9,876 (9,876) A.2 Unlikely to pay 12,098 (4,629) A.3 Non performing past due exposures 2,868 (2,104) A.4 Performing exposures 8,326 (2) 1,576,148 (615) 217,127 (2) 50,415 5,923 (2) Total A 8,326 (2) 1,600,990 (17,224) 217,127 (2) 50,415 5,923 (2) B. Off balance sheet exposures B.1 Bad loans B.2 Unlikely to pay B.3 Other non-performing assets B.4 Performing exposures 42 Total B 42 Total A+B 2016 8,326 (2) 1,601,032 (17,224) 217,127 (2) 50,415 5,923 (2) Total A+B 2015 Due to the change in accounting system, the data for 2015 were too heavy to be extracted and barely relevant in comparison to the information provided. 3. Detail by geographical area of on- and off-balance sheet credit exposures to banks (book value) Exposures / Geographical areas Domestic European Countries America Asia Rest of the world Net Total Net Total Net Total Net Total Net e Total exposure adjustments exposure adjustments exposure adjustments exposure adjustments exposure adjustments A. On balance sheet exposures A.1 Bad loans A.2 Unlikely to pay A.3 Non performing past due exposures A.4 Performing exposures 976,812 148,537 1,396 70,736 Total A 976,812 148,537 1,396 70,736 B. Off balance sheet exposures B.1 Bad loans B.2 Unlikely to pay B.3 Other non-performing assets B.4 Performing exposures Total B Total A+B 2016 976,812 148,537 1,396 70,736 Total A+B 2015 Due to the change in accounting system, the data for 2015 were too heavy to be extracted and barely relevant in comparison to the information provided. 4. Large exposures IOR has no large exposures as defined by art. 46 of AIF Regulation No. 1. 106 IOR Annual report 2016 5.2.5 Securitisation No securitisation transactions were made by the IOR. 5.2.6 Information on unconsolidated structured entities For unconsolidated structured entities, the Institute considers the shares held in externally managed investment funds. For some external funds, the Institute is the owner of a significant number of shares, but does not control these funds because, it does not participate in investment decisions, either directly or indirectly, and it does not hold the ability to affect the returns of the above-mentioned funds. The information required by IFRS 12 on the unconsolidated structured entities is below. As of the balance sheet date, the Institute holds EUR 33.7m in investments in external funds in its trading portfolio. Dividends collected in 2016 on such funds amount to EUR 812,000 (EUR 800,000 in 2015). 70% of the funds in the portfolio are closed-ended funds, and can be subscribed to only at given times by specific parties, who, as mentioned, have no control and the remaining 30% of funds are related to funds that can be subscribed to by different entities at any time and for any amount (openended funds). Conversely, with regard to their asset classes, funds held by the Institute invest in equity securities (30%), debt securities (30%) and the real estate market (40%). Regarding geographical distribution, the criteria used in the above mentioned table was used to separate funds based on their legally registered domicile. According to those criterion, all of the funds are located within the European Union. 107 IOR Annual report 2016 2016 2015 Balance sheet exposure Balance sheet exposure Nominal Value Carrying amount Nominal Value Carrying amount Investment Fund type Open-end fund 75,160 10,404 38,499 5,387 Closed-end fund 20,170,677 13,333 20,170,677 23,357 Hedge fund Exchange traded fund Unit Investment Trust Fund of fund 2,300 9,944 2,300 12,585 Seed Fund Total 20,248,137 33,681 20,211,476 41,329 Underlying asset class focus Equity 2,300 9,944 2,300 12,585 Debt 75,160 10,404 38,499 5,387 Asset Allocation Money Market Real Estate 20,170,000 13,311 20,170,000 23,333 Commodity Alternative Investments 677 22 677 24 Total 20,248,137 33,681 20,211,476 41,329 Geographical Area UE 20,248,137 33,681 20,211,476 41,329 USA Total 20,248,137 33,681 20,211,476 41,329 At the balance sheet date, the IOR did not provide any guidance to unconsolidated structured entities on their investment policies. The Institute has not sponsored any unconsolidated structured entities. At the balance sheet date, the Institute had a standing commitment to one of these funds to third parties of EUR 4m. SGIR is 100% owned by IOR.The Institute does not prepare consolidated financial statements because the resulting information would not be relevant to the readers of the financial statements.The total balance sheet assets of the subsidiary are insignificant when compared with those of the Institute and, accordingly, the consolidated financial statements would not differ significantly from these financial statements. 5.2.7 Models for the measurement of credit risk For the credit risk measurement, the Institute adopted the standard methodology defined by AIF Regulation No. 1, articles 63-89. No individual and portfolio internal models are used. 5.3 Market risks Format and content of information on market risk and relative hedging policies 108 IOR Annual report 2016 5.3.1 Interest rate risk and trading portfolio price risk 5.3.1.1 General aspects Interest rate risk related to the trading portfolio is derived from the Institute’s trading activity in financial instruments, simple and complex, exchanged on organized markets and over-the-counter markets, put in place by the Treasury department. This risk pertains to positions in bonds, particularly those based on a fixed rate, the value of which is closely linked to the trend in interest rates. In line with the objectives of the Treasury Department in liquidity management and capital, and in line with the Institute’s threshold for risk, the level of risk in the trading portfolio is rather low, as indicated by the short holding period (1.37 years). In anticipation of an increase in interest rates, the Institute has further reduced the overall holding period in order to mitigate any negative impact on the value of the portfolio. Price risk comes from the exposure on equity securities, ETF and funds. The Institute reduced the threshold for such risk and exposures come mainly from the need to obtain a diversified return on own equity, in a period characterized by low interest rates. 5.3.1.2 Operating procedures and methods for measuring interest rate risk and price risk Interest rate risk and price risk are measured and managed as part of the overall management and monitoring of risk. Market risk is the risk of change in portfolio value from adverse fluctuations in market parameters, such as interest or currency rates, equity prices or prices of commodities underlying derivative contracts. The Institute’s trading portfolio is comprised mainly of bond securities, and the main associated risks are interest rate and LIBOR spread variation risk, as further described in the next paragraphs. The power to assume market risk lies with the Directorate, which plays an active role in risk management and monitoring, according to the guidelines issued by the Board of Superintendence. Specifically, the Director General delegates the assumption of market risk and management to the Treasury department that operates autonomously in accordance with the limits assigned to the department. Market risk assumption and management is separate from the confirmation, settlement, matching and execution (Back Office) and of the Risk Management department. At 31 December 2016, the Institute did not hold quoted derivatives. A project analysing future interest rates is being performed, with the goal of providing an instrument for hedging the interest rate risk of the bond portfolio. The system of measurement of financial risks and the establishment of operational limits of the Institute are based on the use of statistic calculation tools. Specifically, the three measures of potential loss are: Value at Risk, Expected Shortfall and Stress Test. These measures are defined as follows: • Value at Risk (VaR) is defined as the maximum loss that the Institute could withstand, with probability equal to predetermined confidence levels, in the case of adverse market trends to the position taken; • Expected Shortfall is defined as the average loss that the Institute could withstand in case of a VaR overrun; • StressTest is defined as the loss that the Institute could withstand in case of negative events impacting main risk indicators (equity prices and indexes, interest rates, currency rates, credit spread) analyzed independently and as established by the RAF. 109 IOR Annual report 2016 In addition to the aforementioned measures, the Institute utilises an indicator of realized losses on a 10-day time horizon, defined as the sum of the negative results realized on closed positions and unrealized losses on open positions, valued at market, with reference to the last five working days. The VaR and the Expected Shortfall are calculated using the historic method (at least one year of data and quarterly update of the scenarios), with a daily timeline and confidence level at 99%. The StressTests are calculated by simulating extreme scenarios of the main risk factors, starting from the worst movements recorded in the history of the world’s financial markets, as further described in the following paragraphs. In particular: • for interest rate risk, the variations in interest rates that make up the market curve, the rate volatility risk and correlation risk. On a daily basis, stress test analyses are conducted on the rates curve, assuming substantial shifts of the curve (-40% / +50% with a floor equal to 50 basis points); • for LIBOR spread variation risk, the stress scenarios consider increases depending on the absolute spread level: more precisely, these are set equal to -20/+40 bps for securities with a spread lower than Libor, -40/+80 bps for securities with a spread between 0 and 100 bps and - 40%/+80% of the spread for securities with a spread above 100 bps; • for price risk, different categories of instruments are adequately presented: equities securities, equities indexes, funds and ETF. A stress test analysis is then conducted, applying the defined scenarios to spot prices (from -30% to +30%). Monitoring compliance with limits on a daily basis is performed by the Risk Management department, which provides daily updates to the Directorate on the level of risk assumed and compliance with operational limits. When operational limits have been exceeded, the Risk Management department promptly informs the Directorate of the overrun and the Director General decides on the appropriate action. In establishing a system of market risk measurement, definition of operational limits, and the monitoring of compliance with the limits, the Director General is supported by the Risk Committee, who serves as an advisor on the following matters: • assignment and review limits for of VaR, Expected Shortfall, Stress Test and WCL to the Treasury department; • assignment of additional limits, determined based on nominal sensitivity factor (portfolio sensitivity to the single risk factors), etc; • periodical trend analysis of the Institute’s risk position and identification of the root causes of the unusual trends; • monitoring risks assumed and compliance with the pre-established limits; • total or partial disruption of the activities in certain sensitive financial instruments to risk factors; • analysis of the ordinary and extraordinary events, following particular market turbulences and macroeconomic scenarios. During 2016 the Institute maintained a prudential approach in the management of financial risks. Specifically, during the year, the held for trading portfolio had a daily average VaR of EUR 4.92m, a daily maximum VaR of EUR 6.2m and a daily minimum VaR of EUR 3.72m; the operational limits calculated on 10 working days, determined as EUR 25m under RAF, was never exceeded. At the end of 2016, the VaR amounted to EUR 11.0m. The portfolio only contained highly liquid products. The Risk Management department, to verify the adequacy of the VaR calculation, periodically con- 110 IOR Annual report 2016 ducts retrospective reviews, comparing the actual trading results achieved, with the VaR measures previously calculated. During 2016, the Institute did not identify events where actual daily losses exceeded the risk measures expressed in terms of VaR on a daily basis. The potential impact of a shock of +/- 100 basis point on the portfolio held for trading could have an impact of EUR 24.9m, representing 56.49%, 69.19% and 3.70% of interest margin, profit for the year and equity, respectively. Stress test data at the end of 2016 shows, for interest rate risk, an exposure equal to EUR 12.7m for a variation of +50% of interest rates, with a minimum variation of 50 basis points; the exposure is focused on the EUR rate risk for 70% and on USD rate risk for the remaining 30%. The management and monitoring of risk is continuously improving, and the project related to implementation of the new system by theTreasury department is under completion; when completed, the project will allow: • monitoring of positions, profits and risks real time (automatic feed of main risk parameters and continuous revaluation of the position, calculation of the VaR position at any time of the day); • possibility of monitoring P&L trend and risks in different aggregation levels, from the single instrument, to the entire position of the Treasury department. 2.1 Trading portfolio: detail by maturity date (re-pricing date) of financial assets and liabilities on balance sheet and financial derivatives Type / Expiration date On Up to 3 3-6 6-12 1-5 5-10 Over Non demand months months months years years 10 years defined A. Cash assets 1.1 Debt securities - with early redemption option 70,199 3,392 - other 729,708 295,561 80,132 589,870 55,488 515 1.2 Other assets 2. Cash liabilities 2.1 Repurchase agreements 2.2 Other liabilities 3. Financial derivatives 3.1 With underlying security - Options + Long positions + Short positions - Other derivatives + Long positions + Short positions 3.2 Without underlying security - Options + Long positions + Short positions - Other derivatives + Long positions + Short positions 111 IOR Annual report 2016 2.2 Trading portfolio: detail of equity securities and index exposures for the main countries quoted markets Type / Quotation index Quoted Italian NYSE Xetra New NASDAQ Other Non Stock Arca York GS quoted Exchange A. Equity securities - long positions 23,002 10,515 7,441 3,833 3,330 4,609 - short positions B. Transactions not yet settled on equity securities - long positions - short positions C. Other derivatives on equity securities - long positions - short positions D. Derivatives on equity index - long positions - short positions With reference to price risk of other financial instruments classified as held for trading, at the end of 2016, the Institute’s portfolio had the following exposure: • Closed-end funds EUR 23,3m; • Open-end funds EUR 10,4m. 112 IOR Annual report 2016 5.3.2 Interest rate risk and price risk of other financial instruments in portfolio 2.1 Other financial instruments in portfolio: detail by expiration date (re-pricing date) of financial assets and liabilities Type / Expiration date On Up to 3 3-6 6-12 1-5 5-10 Over Non demand months months months years years 10 years defined 1. Cash assets 1.1 Debt securities - with early redemption option 10,020 - other 24,280 231,679 75,436 168,784 48,757 1.2 Loans to banks 457,624 100,006 60,548 25,052 1.3 Loans to customers - current accounts 8,452 - other loans - with early redemption option 13,527 - other 7,174 2. Cash liabilities 2.1 Due to customers - current accounts 2,397,688 - other liabilities - with early redemption option - other 855 382 2.2 Due to banks - current accounts - other liabilities 2.3 Debt securities - with early redemption option - other 2.4 Other liabilities - with early redemption option - other 3. Financial derivatives 3.1 With underlying security - Options + Long positions + Short positions - Other derivatives + Long positions + Short positions 3.2 Without underlying security - Options + Long positions + Short positions - Other derivatives + Long positions + Short positions 4. Other off balance sheet transactions + Long positions + Short positions Regarding interest rate risk for financial instruments other than those classified as trading, the Institute’s exposure refers mainly to the assets classified as held to maturity and to interbank deposits, already listed in the paragraph related to credit risk. 113 IOR Annual report 2016 The application of a variation of interest rates of +/- 100 basis points to the portfolio, including other financial instruments (EUR 559m) shows a potential impact of EUR 8.65m, representing 19.62%, 24.03% and 1.29% of interest margin, profit for the year and equity, respectively. With reference to price risk of financial instruments not classified as trading, at the end of 2016, the Institute’s portfolio had the following exposure: • Financial assets available for sale EUR 6,7m; • Investment in subsidiaries SGIR S.r.l. EUR 15,8m. Regarding the limits, the Board of Superintendence established limits for the investment in financial assets held to maturity in relation to equity. For this portfolio a measure of VaR is also calculated (respectively EUR 0.74m, 0.97m and 2.23m of minimum, medium and maximum daily value), but not associated with limits. 5.3.3 Currency risk General aspects, operating procedures and methods for measuring currency risk Currency risk is the risk that the Institute can incur losses on the portfolio held for trading due to the adverse variation of currency rates and the price of gold. As mentioned above, the management of currency risk is based on the system in place for the management of financial risks. For the currency rate, as it was for interest rates, the following pre-defined StressTest scenarios were used for each currency providing shock higher for minorcurrencies and for those not related to Euro. The potential impact of these shocks could result in loss of approximately EUR 2.8m. 2.1 Detail by currency of financial assets, liabilities and derivatives Currencies USD GBP CAD AUD CHF Other Items currencies A. Financial assets A.1 Debt securities 581,767 2,373 471 1,894 3,986 226 A.2 Equity securities 31,189 684 7 6 A.3 Loans to banks 55,625 16,320 8,716 7,237 146 6,123 A.4 Loans to customers 17 A.5 Other financial assets 7,561 127 959 353 1,145 1,173 B. Other assets 21,715 C. Financial liabilities C.1 Due to banks C.2 Due to customers 664,165 13,213 5,036 7,007 9,506 2,414 C.3 Debt securities C.4 Other financial liabilities 3,049 42 907 2 5 D. Other liabilities E. Financial derivatives - Options + Long positions + Short positions - Other derivatives + Long positions + Short positions Total Assets 697,874 19,404 10,146 9,484 5,284 7,528 Total Liabilities 667,214 13,255 5,943 7,009 9,511 2,414 Difference (+/-) 30,660 6,149 4,203 2,475 (4,227) 5,114 114 IOR Annual report 2016 The exchange rate risk exposure resulting from the application of the abovementioned stress tests of 100 basis point at 31 December 2016 resulted in an amount equal to EUR 0.45m, representing 1.02%, 1.25% and 0.07% of interest margin, profit for the year and equity, respectively. For capital requirement calculation related to currency risk, the IOR adopted the standard methodology provided by AIF Regulation No. 1. 5.3.4 Derivative instruments In 2016 IOR did not hold derivative financial instruments. 5.4 Liquidity risk Format and content of information on liquidity risk and relative hedging policies 5.4.1 General aspects, operating procedures and methods for measuring liquidity risk Liquidity risk is the risk that the Institute will encounter difficulties in meeting payment obligations by cash or by expected or unexpected delivery, compromising the daily operations or the financial situation. Regarding liquidity risk, during 2016, the IOR did not encounter any notable problems: starting from January 2016, the liquidity risk measurement methodologies have been defined according to the provisions of AIF Regulation No. 1; the liquidity risk indicator (LCR), calculated over a period of 30 days, resulted in a value equal to 395.4%, well above the regulatory limit of 200% established by RAF. It is important to note that Institute liabilities are represented, other than equity, by deposits from customers, mainly on demand. Moreover the Institute does not carry out funding transactions on the interbank market or on the capital market. From an organizational standpoint, the Institute’s liquidity risk is managed by theTreasury Department which monitors the expected and realized flows in currencies and maintains an adequate portfolio of liquid assets to meet any unexpected payments. Monitoring of liquidity and adherence to liquidity operating limits are performed daily by the Risk Management Department. The following tables show the Institute’s assets and liabilities with current values, divided by contractual maturities of the financial liabilities and the expected maturities of the financial assets. The first table includes only financial assets and liabilities in Euro, while the second table comprises only financial assets and liabilities in other currency than Euro. 115 IOR Annual report 2016 1.1 Detail by contractual residual maturity of financial assets and liabilities in Euro On 1-7 7-15 15-30 1-3 3-6 6-12 1-5 Over 5 Non Type / Residual maturity demand days days days months months months years years defined Cash assets B.1 Government bonds 31 5,457 52,298 151,027 166,128 939,595 B.2 Other debt securities 1 7,820 13,416 20,008 204,681 136,914 480,608 B.3 UCI units 33,681 B.4 Loans - Banks 363,455 80,000 20,006 60,548 25,052 - Customers 8,436 37 7 57 3,980 4,857 11,762 Cash liabilities B.5 Deposits and current accounts - Banks - Customers 1,697,582 B.6 Debt securities B.7 Other liabilities Off balance sheet transactions B.8 Financial derivatives with exchange of capital - long positions - short positions B.9 Financial derivatives without exchange of capital - long positions - short positions B.10 Deposits and loans to be settled - long positions - short positions B.11 Irrevocable commitments to lend funds - long positions - short positions B.12 Financial guarantees given B.13 Financial guarantees received B.14 Credit derivatives with exchange of capital - long positions - short positions B.15 Credit derivatives without exchange of capital - long positions - short positions 116 IOR Annual report 2016 1.2 Detail by contractual residual maturity of financial assets and liabilities in other currency than Euro On 1-7 7-15 15-30 1-3 3-6 6-12 1-5 Over 5 Non Type / Residual maturity demand days days days months months months years years defined Cash assets B.1 Government bonds 159 1 27 331 25,906 61,607 3,339 B.2 Other debt securities 89 161 12,243 25,870 9,221 30,114 B.3 UCI units B.4 Loans - Banks 94,168 - Customers 17 Cash liabilities B.5 Deposits and current accounts - Banks - Customers 700,105 649 206 382 B.6 Debt securities B.7 Other liabilities Off balance sheet transactions B.8 Financial derivatives with exchange of capital - long positions - short positions B.9 Financial derivatives without exchange of capital - long positions - short positions B.10 Deposits and loans to be settled - long positions - short positions B.11 Irrevocable commitments to lend funds - long positions - short positions B.12 Financial guarantees given B.13 Financial guarantees received B.14 Credit derivatives with exchange of capital - long positions - short positions B.15 Credit derivatives without exchange of capital - long positions - short positions 5.5 Operational risk Format and content of information on operational risk and relative hedging policies 5.5.1 General aspects, operating procedures and methods for measuring operational risk Operational risks represent the risk of loss caused by inadequate and failure of processes, human resources and internal system, or caused by external events. Operational risk does not include strategic and reputational risks, but includes legal risk, which is 117 IOR Annual report 2016 the risk of loss from violations of laws and regulations, contractual or non-contractual liability, or other disputes. Operational risks include, among other things, administrative risk (for example, absence or inadequacy of line controls), human resources risk (for example, a lack of professional training for staff), and IT risk (for example, inadequacy of the computer system that could cause loss of data or interruption of operations). The Institute is defining a framework for operational risk management, establishing the organizational processes for measurement, management and control of that risk. More specifically, the risk assessment framework for the Institute’s activities provides an assessment of the operational risk of each process (unmitigated risk), a verification of the tools for monitoring and mitigation of this risk and an assessment of the residual risks (mitigated risk). Definition of a framework for the recognition of operational risk events is also under analysis, which will include an Institute database which such events and the mitigating actions taken will be input. “Operational risk event” is an event of any nature that “potentially” may generate a loss for the Institute, and not only events that have caused an actual loss. Generally, these events do not generate losses, but it is important to record them to highlight possible areas of exposure to a high number of events.The Institute has to take action with regard to these events with organizational changes (when there are problems with the processes), technological changes (when there are technical problems) and/or training changes (when there are problems related to human errors). This activity allows the Institute to mitigate the risk that these events, if repeated in the future, can generate real losses. For compliance with the Regulation No. 1, the business lines will be directly involved in the Operational Risk Management process, through the establishment of specifically in the collection and classification of data about events that have generated operating losses, and the risk assessment associated with the operating environment. From an organizational point of view, the monitoring of the Institute’s operational risks will be managed by an Operational Risk Management (ORM) unit, located within the IOR Risk Management department.The ORM will be responsible for development of methodologies for risk measurement and the processing of loss data, and will also responsible for the preparation of reporting tools. The ORM will promptly inform the Directorate of the most significant operational events, and will prepare a periodical report analyzing the trend in operational risks, events that have occurred, and the actions taken to resolve the main critical issues. Extraordinary losses and operating losses have been recorded during 2016 for a total amount of EUR 729,000, of which around EUR 250,000 related to external transactions not authorized (credit cards and payment services). In this regard, corrective measures have been taken to prevent such events from happening again in the future. In addition, negative accounting reconciliation was recorded for approximately EUR 386,000 related to the customers assets (or securities) deposited with third parties, of which the Institute decided to cover. Finally, there is a provision to risks and charges item amounting to EUR 3.5m related to probable contingencies related to tax issues towards foreign countries, decreasing from the previous year. 118 IOR Annual report 2016 PART 6. INFORMATION CONCERNING EQUITY 6.1 Shareholders’ Equity 6.1.1 Qualitative information The Institute’s equity represents capital funding provided by the owner or generated by the business to create value. In managing capital (a broader concept than “equity” presented in the balance sheet and consistent with regulatory capital, which is not comprised solely of equity in the strict sense), the Institute’s objectives are: • to safeguard the Institute’s ability to continue as a going concern, so that it can continue to provide benefits for all stakeholders; • to maintain a strong capital base to support business growth. The Institute pursues its objectives of capital management during the planning processes, through the analysis of risks associated with planned activities, and during the monitoring processes through the analysis and monitoring compliance with limits. In managing capital, the Institute observes regulatory capital requirements established by the regulatory framework related to prudential supervision. 6.1.2 Quantitative information 1 Detail 2016 2015 1. Capital 300,000 300,000 2. Reserves (a) Earning reserves (i) Unavailable 100,000 100,000 (ii) Available 282,134 282,134 (iii) Other (b) Other 3. Equity instruments 4. Valuation reserves (a) Available for sale assets 499 4.777 (b) Tangible assets (c) Intangible assets (d) Hedging of foreign investments (e) Cash flows hedging (f) Exchange differences (g) Non current assets held for sale (h) Actuarial gains (losses) on defined benefit plans (46,034) (32,759) (i) Share of valuation reserves connected with investments carried at equity 5. Profit (loss) for the year 36,001 16,127 Total 672,600 670,278 Capital, clearly identified as a component of Equity, represents a permanent endowment that cannot be reduced or distributed, except in case of cessation or liquidation of the entity. 119 IOR Annual report 2016 Unavailable Reserves are profit reserves designed to further strengthen theInstitute’s Equity and longterm stability. Available or “distributable” Reserves are earnings available for distribution, subject to a resolution of the Commission of Cardinals. Fair Value Reserves for available for sale securities represents the net fair value gain/loss recognized on investment securities classified as available for sale. Post-employment benefit actuarial gain (loss) Reserves represents the actuarial unrealised gain or loss related to the post-employment benefit plans. 2 Fair value reserve of financial assets available for sale: detail 2016 2015 Positive Reserve Negative Reserve Positive Reserve Negative Reserve 1. Debt securities 2. Equity securities 499 4,777 3. UCI units 4. Loans Total 499 4,777 3 Fair value reserve of financial assets available for sale: annual changes Debt securities Equity securities UCI units Loans 1. Opening balance 4,777 2. Positive changes 2.1 Fair value increases 112 2.2 Reclassification from negative reserves to the Income statement: From Impairment 148 From disposal 2.3 Other changes 3. Negative changes 3.1 Fair value decreases (1,949) 3.2 Impairment 3.3 Reclassification from positive reserves to the Income statement: From disposal (2,589) 3.4 Other changes 4. Closing balance 499 4 Valuation reserves related to defined benefit plans: annual changes Defined benefit plan 1. Opening balance (32,759) 2. Positive changes 2.1 Post-employment benefit actuarial gain of the year 3. Negative changes 3.1 Post-employment benefit actuarial loss of the year (13,275) 4. Closing balance (46,034) 120 IOR Annual report 2016 6.2 Own equity and prudential supervision ratios 1 Own equity 2016 2015 A. Positive components 1. Capital 300,000 300,000 2. Supplemental Capital Retained earnings (i) Unavailable 100,000 100,000 (ii) Available 282,134 282,134 (iii) Others Provisions Reserves (45,535) (27,981) 3. Positive prudential filter IAS/IFRS B. Negative components 1. Goodwill 2. Intangible assets (1,044) (875) 3. Impairments on loans 4. Losses recognized in previous years and in current year 5. Regulatory downs of assets carried at fair value 6. Negative prudential filter IAS/IFRS (250) (2,389) Common Equity 635,305 650,888 Capital is defined by AIF Regulation No.1 art. 3 (8) as the initial funding or subsequent integration of capital by the Holy See or the Vatican City State. a. it is paid in pursuant to the legislation of the Holy See and the Vatican City State; b. it is clearly and distinctly identified in the financial statements; c. it cannot be reduced or distributed, except in the case of cessation or liquidation of the entity, ensuring that it is distributed proportionality to legitimate creditors, according to the legislation of the Holy See and the Vatican City State and acquired by the Apostolic See. For regulatory purposes, the term “Capital” shall be considered as equivalent to “core capital”. The Supplemental Capital is defined under AIF Regulation No. 1 art. 3 (68) as the sum of retained earnings, accumulated as other comprehensive income and other reserves. The Common Equity is defined under Regulation No. 1, art. 3 (12) as: – the sum of the following positive components: a. the Capital; b. the supplemental capital; – deducting the following components (if negative): a. goodwill; b. intangible assets; c. adjustments to the value of receivables; d. losses recognized in previous financial periods and in the current period; e. adjustments to the regulatory value of assets valued at their “fair value”. For regulatory purposes, “common equity” shall be considered as equivalent to “common equity tier 1”. Regulatory capital consists of common equity and is calculated by the Institute on a monthly basis, although only required to be calculated by the Supervisory Authority quarterly. 121 IOR Annual report 2016 As required, the amount of annual and half-yearly earnings, excluding the amounts that can potentially be allocated to dividends, contributes to the calculation of regulatory capital for the months of December and June. The Common Equity at the end of 2016 amounted to EUR 635.3m (2015: EUR 650.9m). Considering the items comprising the Institute’s equity, the sole prudential filter in common equity at 31 December 2016 is associated with the positive fair value reserve relating to the investment securities held in the Available for Sale portfolio. This reserve is computed using a negative prudential filter, for an amount equal to 50%. In the calculation of the Regulatory Capital 2016, the Net profit for the year not included, as it is considered fully distributed. 6.2.2 Capital adequacy The monitoring of key ratios is performed daily by the Risk Management Department, in order to continuously monitoring compliance with regulatory requirements. The table below shows the data relating to capital requirements at the end of 2016 and at the end of 2015 for comparison. In order to allow a correct comparison, the 2015 figures have been restated to take account the Authority’s latest notes regarding the weighting of some risks. Unweighted amounts Weighted amounts/ Capital requirements 2016 2015 2016 2015 A. Risk asset A.1 Credit and counterparty risk 1. Standardised approach 1,333,514 1,533,600 360,173 457,872 2. Approach based on internal ratings 2.1 Based 2.2 Advanced 3. Securitizations B. Capital requirements B.1 Credit and counterparty risk 28,814 36,630 B.2 Credit valuation adjustment risk B.3 Settlement risk B.4 Market risk 1. Standardised approach 40,245 39,814 2. Internal model 3. Concentration risk B.5 Operational risk 1. Basic indicator approach 9,699 9,405 2. Standardised approach 3. Advanced approach B.6 Other calculation elements B.7 Total capital requirements 78,758 85,849 C. Risk weighted assets and capital ratios C.1 Risk-weighted assets 984,472 1,073,116 C.2 Capital/ Risk-weighted assets 30.47% 27.96% C.3 Common equity/Risk-weighted assets 64.53% 60.65% 122 IOR Annual report 2016 PART 7. RELATED PARTY TRANSACTIONS Related parties of the Institute include key management personnel (Directorate and Board of Superintendence), the Commission of Cardinals and the Revisori. Transactions with these related parties relate to salaries and remuneration Details of key management compensation Compensation due to related parties were EUR 647,000 in 2016, of which EUR 203,200 was not yet paid as of 31 December 2016. Specifically, these expenses relate to: • EUR 264,500 for the Board of Superintendence of which EUR 120,000 has not yet been paid; • EUR 299,300 for the Directorate; • EUR 83,200 for the Revisori, completely paid. These amounts are recognized in the Income Statement as Operating Expenses. Related-party transactions During 2016, no transactions with key management were entered into, except for the management of the deposit accounts opened with the Institute and salaries and remuneration discussed above. As of the balance sheet date, the balance of deposits by the members of the Commission of Cardinals was EUR 3.4m. Key management personnel and Revisori had deposits totaling EUR 610,000. The Institute has a long-term zero-interest loan to its subsidiary SGIR S.r.l., amounting to EUR 3.3m. In October 2015, the Institute signed the loan for the use of 4 real estate properties at no cost with its subsidiary SGIR S.r.l. During 2016, SGIR S.r.l. did not earn rental income on these properties. 123 IOR Annual report 2016 REPORT OF THE REVISORI To the Board of Superintendence of the Institute In this report, drawn up in accordance with Article 28 of the Statute, the Board of Auditors of the Institute (the "Institute" or the "IOR") remarks on the annual financial statements, the report and the supporting documents, as prepared by the Directorate for the financial year 2016. In performing its work, the Board has responded to the Holy Father’s venerable invitation, expressed in his letter of 30 January 2017, to apply "determination in observing the statutory requirements". This invitation follows the ethical path already demarcated by His Holiness at the meeting of November 2015, where it was indicated that the Board of Auditors should "act with due impartiality and independence". During the financial year, the Board of Statutory Auditors convened periodically to perform its duties and attended, upon invitation, all the meetings of the Board of Superintendence. The meetings of the Board of Auditors were characterized by intense work sessions and benefited from the members’ diverse skills as well as the solid support of the President, the Directorate and, where necessary, the Institute’s Administration and Control Functions. The Board also noted that in 2016, through the provision of dedicated services, the Institute confirmed its commitment to serving the Holy Father in the fulfilment of his mission as universal pastor. Activities carried out in compliance with the Statute’s provisions The Board reports that, in accordance with Article 27 of the Statute, during 2016 it carried out the audits of treasury assets falling within its jurisdiction, as well as the administrative and accounting review of the books and accounts, also by obtaining information from the heads of the internal control functions, and has no remarks to make in this respect. IOR Annual report 2016 127 At the specific request of the Board of Superintendence, the Board of Auditors also carried out internal reviews and other checks. In relation to these activities, the Board notes that the Board of Superintendence instructed certain Board members to take part in a working group in order to draft the Internal Regulations of the Institute, in accordance with the requirements set out under Articles 3, 17 and 24 of the Statute, also taking into account the recommendations made by the Holy Father during his intervention at the Board of Superintendence meeting of 24 November 2015. 2016 financial statements Pursuant to Article 28 of the current Statute, the Board of Auditors of the Institute examined the 2016 financial statements (“Financial Statements”) and the Management Report. The Financial Statements were drawn up in accordance with the Circular on the Preparation of the Annual Financial Statements and Consolidated Financial Statements of Entities carrying out Financial Activities on a Professional Basis, issued by the Financial Information Authority on 15 December 2016. Since this is the first financial year to which these new drafting principles have been applied, the financial data for 2015 have also been reclassified in accordance with the provisions laid down in the Circular, to make a comparison possible. The Financial Statements are made up of the following: • Balance Sheet; • Profit and Loss Statement; • Comprehensive Profit and Loss Statement; • Statement of Cash Flows; • Statement of Changes in Equity. The Annual Report includes the above documents as well as a description of the Institute's activities, a summary of the accounting policies as well as the risks and uncertainties linked to the use of estimates, the explanatory notes to the Financial Statements, and financial risk information prepared in accordance with the Vatican rules on prudential supervision. 128 IOR Annual report 2016 129 IOR Annual report 2016 The Financial Statements may be summarised as follows: EUR000 BALANCE SHEET Total assets 3,268,890 Total liabilities 2,596,290 Net assets 672,600 PROFIT AND LOSS ACCOUNT Net result from financial activities 42,762 Net operating profit 36,001 Profit available for distribution 36,001 The Financial Statements have been audited by Deloitte & Touche S.p.A., which expressed a clean and unqualified opinion on 26 April 2017. Based on the audits that have been performed, and taking into account the conclusions drawn by the internal control functions and the audit firm’s unqualified opinion, this Board of Auditors: • is in favour of the approval of the 2016 financial statements (Financial Statements) included in the Annual Report, as prepared by the Directorate; • agrees with the proposed allocation of the net operating profit. Vatican City State, 26 April 2017 The Board of Statutory Auditors Mario Busso Giovanni Barbara Luca Del Pico This report has been translated into the English language solely for convenience of international readers. REPORT OF THE EXTERNAL AUDITORS IOR Annual report 2016 133 134 IOR Annual report 2016 135 IOR Annual report 2016 Printing Iger & Partners S.r.l. Rome - Italy june 2017

http://www.ior.va/content/dam/ior/documenti/rapporto-annuale/IOR-Annual%20Report%202016.pdf

Vix Pervenit

On Usury and Other Dishonest Profits

Pope Benedict XIV - November 1, 1745

To the Venerable Brothers, Patriarchs, Archbishops, Bishops and Ordinary Clergy of Italy.
Venerable Brothers, Greetings and Apostolic Benediction.
Hardly had the new controversy (namely, whether certain contracts should be held valid) come to our attention, when several opinions began spreading in Italy that hardly seemed to agree with sound doctrine; We decided that We must remedy this. If We did not do so immediately, such an evil might acquire new force by delay and silence. If we neglected our duty, it might even spread further, shaking those cities of Italy so far not affected.
Therefore We decided to consult with a number of the Cardinals of the Holy Roman Church, who are renowned for their knowledge and competence in theology and canon law. We also called upon many from the regular clergy who were outstanding in both the faculty of theology and that of canon law. We chose some monks, some mendicants, and finally some from the regular clergy. As presiding officer, We appointed one with degrees in both canon and civil law, who had lengthy court experience. We chose the past July 4 for the meeting at which We explained the nature of the whole business. We learned that all had known and considered it already.
2. We then ordered them to consider carefully all aspects of the matter, meanwhile searching for a solution; after this consideration, they were to write out their conclusions. We did not ask them to pass judgment on the contract which gave rise to the controversy since the many documents they would need were not available. Rather We asked that they establish a fixed teaching on usury, since the opinions recently spread abroad seemed to contradict the Church’s doctrine. All complied with these orders. They gave their opinions publicly in two convocations, the first of which was held in our presence last July 18, the other last August 1; then they submitted their opinions in writing to the secretary of the convocation.
3. Indeed they proved to be of one mind in their opinions.
I. The nature of the sin called usury has its proper place and origin in a loan contract. This financial contract between consenting parties demands, by its very nature, that one return to another only as much as he has received. The sin rests on the fact that sometimes the creditor desires more than he has given. Therefore he contends some gain is owed him beyond that which he loaned, but any gain which exceeds the amount he gave is illicit and usurious.
II. One cannot condone the sin of usury by arguing that the gain is not great or excessive, but rather moderate or small; neither can it be condoned by arguing that the borrower is rich; nor even by arguing that the money borrowed is not left idle, but is spent usefully, either to increase one’s fortune, to purchase new estates, or to engage in business transactions. The law governing loans consists necessarily in the equality of what is given and returned; once the equality has been established, whoever demands more than that violates the terms of the loan. Therefore if one receives interest, he must make restitution according to the commutative bond of justice; its function in human contracts is to assure equality for each one. This law is to be observed in a holy manner. If not observed exactly, reparation must be made.
III. By these remarks, however, We do not deny that at times together with the loan contract certain other titles-which are not at all intrinsic to the contract-may run parallel with it. From these other titles, entirely just and legitimate reasons arise to demand something over and above the amount due on the contract. Nor is it denied that it is very often possible for someone, by means of contracts differing entirely from loans, to spend and invest money legitimately either to provide oneself with an annual income or to engage in legitimate trade and business. From these types of contracts honest gain may be made.
IV. There are many different contracts of this kind. In these contracts, if equality is not maintained, whatever is received over and above what is fair is a real injustice. Even though it may not fall under the precise rubric of usury (since all reciprocity, both open and hidden, is absent), restitution is obligated. Thus if everything is done correctly and weighed in the scales of justice, these same legitimate contracts suffice to provide a standard and a principle for engaging in commerce and fruitful business for the common good. Christian minds should not think that gainful commerce can flourish by usuries or other similar injustices. On the contrary We learn from divine Revelation that justice raises up nations; sin, however, makes nations miserable.
V. But you must diligently consider this, that some will falsely and rashly persuade themselves-and such people can be found anywhere-that together with loan contracts there are other legitimate titles or, excepting loan contracts, they might convince themselves that other just contracts exist, for which it is permissible to receive a moderate amount of interest. Should any one think like this, he will oppose not only the judgment of the Catholic Church on usury, but also common human sense and natural reason. Everyone knows that man is obliged in many instances to help his fellows with a simple, plain loan. Christ Himself teaches this: “Do not refuse to lend to him who asks you.” In many circumstances, no other true and just contract may be possible except for a loan. Whoever therefore wishes to follow his conscience must first diligently inquire if, along with the loan, another category exists by means of which the gain he seeks may be lawfully attained.
4. This is how the Cardinals and theologians and the men most conversant with the canons, whose advice We had asked for in this most serious business, explained their opinions. Also We devoted our private study to this matter before the congregations were convened, while they were in session, and again after they had been held; for We read the opinions of these outstanding men most diligently. Because of this, We approve and confirm whatever is contained in the opinions above, since the professors of Canon Law and Theology, scriptural evidence, the decrees of previous popes, and the authority of Church councils and the Fathers all seem to enjoin it. Besides, We certainly know the authors who hold the opposite opinions and also those who either support and defend those authors or at least who seem to give them consideration. We are also aware that the theologians of regions neighboring those in which the controversy had its origin undertook the defense of the truth with wisdom and seriousness.
5. Therefore We address these encyclical letters to all Italian Archbishops, Bishops, and priests to make all of you aware of these matters. Whenever Synods are held or sermons preached or instructions on sacred doctrine given, the above opinions must be adhered to strictly. Take great care that no one in your dioceses dares to write or preach the contrary; however if any one should refuse to obey, he should be subjected to the penalties imposed by the sacred canons on those who violate Apostolic mandates.
6. Concerning the specific contract which caused these new controversies, We decide nothing for the present; We also shall not decide now about the other contracts in which the theologians and canonists lack agreement. Rekindle your zeal for piety and your conscientiousness so that you may execute what We have given.
7. First of all, show your people with persuasive words that the sin and vice of usury is most emphatically condemned in the Sacred Scriptures; that it assumes various forms and appearances in order that the faithful, restored to liberty and grace by the blood of Christ, may again be driven headlong into ruin. Therefore, if they desire to invest their money, let them exercise diligent care lest they be snatched by cupidity, the source of all evil; to this end, let them be guided by those who excel in doctrine and the glory of virtue.
8. In the second place, some trust in their own strength and knowledge to such an extent that they do not hesitate to give answers to those questions which demand considerable knowledge of sacred theology and of the canons. But it is essential for these people, also, to avoid extremes, which are always evil. For instance, there are some who judge these matters with such severity that they hold any profit derived from money to be illegal and usurious; in contrast to them, there are some so indulgent and so remiss that they hold any gain whatsoever to be free of usury. Let them not adhere too much to their private opinions. Before they give their answer, let them consult a number of eminent writers; then let them accept those views which they understand to be confirmed by knowledge and authority. And if a dispute should arise, when some contract is discussed, let no insults be hurled at those who hold the contrary opinion; nor let it be asserted that it must be severely censured, particularly if it does not lack the support of reason and of men of reputation. Indeed clamorous outcries and accusations break the chain of Christian love and give offense and scandal to the people.
9. In the third place, those who desire to keep themselves free and untouched by the contamination of usury and to give their money to another in such a manner that they may receive only legitimate gain should be admonished to make a contract beforehand. In the contract they should explain the conditions and what gain they expect from their money. This will not only greatly help to avoid concern and anxiety, but will also confirm the contract in the realm of public business. This approach also closes the door on controversies-which have arisen more than once-since it clarifies whether the money, which has been loaned without apparent interest, may actually contain concealed usury.
10. In the fourth place We exhort you not to listen to those who say that today the issue of usury is present in name only, since gain is almost always obtained from money given to another. How false is this opinion and how far removed from the truth! We can easily understand this if we consider that the nature of one contract differs from the nature of another. By the same token, the things which result from these contracts will differ in accordance with the varying nature of the contracts. Truly an obvious difference exists between gain which arises from money legally, and therefore can be upheld in the courts of both civil and canon law, and gain which is illicitly obtained, and must therefore be returned according to the judgments of both courts. Thus, it is clearly invalid to suggest, on the grounds that some gain is usually received from money lent out, that the issue of usury is irrelevant in our times.
11. These are the chief things We wanted to say to you. We hope that you may command your faithful to observe what these letters prescribe; and that you may undertake effective remedies if disturbances should be stirred up among your people because of this new controversy over usury or if the simplicity and purity of doctrine should become corrupted in Italy. Finally, to you and to the flock committed to your care, We impart the Apostolic Benediction.
Given in Rome at St. Mary Major, November 1, 1745, the sixth year of Our Pontificate.


Trump & pédo-criminels

$
0
0


Depuis la victoire électorale de Trump, des pédo-criminels d’ "élite" comme de "pseudo""juifs sionistes" Harvey Weinstein, Jeff Epstein, Anthony Weiner, et Mark Salling et onze maires démocrates ont été arrêtés ou sont actuellement impliqués dans de grands scandales de pédophilie.
Pendant le premier mois de son mandat au pouvoir, Trump a arrêté plus de 1500 personnes pour des accusations de pédophilie. Les médias traditionnels ont non seulement refusé de parler du trafic sexuel pédophile parmi les élites, mais ils ont activement couvert les pédophiles ( pedo-criminels) parce que beaucoup de médias sont impliqués.

Dernièrement, l’ancienne vedette de Glee, Mark Salling, a plaidé coupable pour une possession de pornographie juvénile découlant d’un acte d’accusation déposé l’année dernière. Il a admis avoir téléchargé plus de 50.000 images et vidéos de pornographie infantile. Plusieurs femmes ont accusé Salling d’agression sexuelle.
http://www.latimes.com/local/lanow/la-me-ln-mark-salling-plea-20171004-story.html

L’ancienne vedette des «Sons of Guns», Will Hayden a été condamnée à la prison à vie en mai pour avoir violé deux enfants. Hayden a été reconnu coupable de violer à plusieurs reprises deux filles pendant des années entre l’âge de 11 et 13 ans. La fille de Hayden, Stephanie, qui a également joué dans le spectacle, a été arrêtée en 2014 sur des allégations d’abus sur enfant. Elle aurait permis à son mari d’abuser sexuellement de son fils. Elle a dit que son père l’avait abusé d’elle lorsqu’elle était enfant, et que son père avait violé l’une des victimes présumées « presque quotidiennement » pendant un an.
https://www.aol.com/article/entertainment/2017/05/12/sons-of-guns-discovery-channel-will-hayden-rape-life-prison-sentence/22083641/

Autre proche collaborateur et allié des Clinton, le pédophile Jeffrey Epstein a payé 5,5 millions de dollars pour régler les poursuites intentées par trois parmi plus de deux douzaines d’adolescents qui l’ont poursuivi en justice. Epstein a été accusé d’avoir recruté des dizaines de filles mineures comme esclaves sexuelles pour ses riches amis.
http://nypost.com/2016/10/09/the-sex-slave-scandal-that-exposed-pedophile-billionaire-jeffrey-epstein/
Il avait emmené beaucoup de mineur(e)s sur son île privée, dite l’île aux sexes, que Bill Clinton a visité environ deux douzaines de fois selon les journaux de bord, de l’avion privé d’Epstein, appelé « Lolita express ». Mais il fut aussi découvert qu’Epstein était en réalité un agent du Mossad, qui organise ces orgies pour les hautes personnalités américaines, arabes et autres, pour enregistrer leurs ébats avec des mineur(e)s et les tenir par le chantage. L’élite politique américaine ne peut plus bouger un cil sans l’autorisation du Mossad et du lobby juif.

Le 25 septembre, un juge a condamné Anthony Weiner, un autre proche allié des Clintons, à 21 mois de prison pour sexe sur mineure. L’épouse de Weiner, Huma Abedin, a travaillé en tant que principale aide de Clinton pendant qu’elle était secrétaire d’État et pendant ses deux campagnes présidentielles.
http://edition.cnn.com/2017/09/25/politics/anthony-weiner-sentencing/index.html

Onze maires libéraux accusés de crimes sexuels impliquant des enfants ont été arrêtés depuis 2016.
http://dailycaller.com/2017/09/13/at-least-11-mayors-accused-of-child-sex-related-crimes-since-2016/

De plus, les autorités ont arrêté le maire Bill de Blasio, ainsi que son adjoint Jacob Schwartz pour pornographie infantile à New York le 25 mai. Schwartz avait 3000 images de pornographie infantile, y compris le viol d’un bébé de 6 mois. Le père de Schwartz, Arthur Schwartz, est un avocat du travail et un démocrate de premier plan. Même si Schwartz est apparu sur CNN, ce réseau a refusé de parler de cette histoire à ce jour.

Ralph Shortey, ancien sénateur de l’État d’Oklahoma, a été accusé en Mars de trafic d’enfants à des fins sexuelles, de production de pornographie juvénile et de pornographie juvénile impliquant une fille prépubère et de jeunes garçons.
http://kfor.com/2017/09/06/former-sen-ralph-shortey-faces-federal-charges-for-child-pornography-child-sex-trafficking/

Un nouvel accusateur a intenté une action en justice contre Dennis Hastert en mai, alléguant que l’ancien président de la Chambre l’avait sodomisé il y a plusieurs décennies. Hastert a été inculpé en 2015 pour avoir versé de l’argent à des victimes qu’il a reconnu avoir molesté quand elles étaient enfants car il a servi comme entraîneur de lutte de 1965 à 1981.
http://www.chicagotribune.com/news/local/breaking/ct-dennis-hastert-lawsuit-met-20170527-story.html
Il est aussi connu que certains vont jusqu’à implanter des puces sur ces enfants violés pour mieux les contrôler :


Pédo-criminels en Suisse ?


Révolté par les implications financières liées à l’événement « Saga des Géants » de la compagnie Royal de Luxe !

Invitations monnaie-pleine à Neuchâtel, Yverdon, Genève

$
0
0
Bonjour,

Mieux comprendre www.monnaie-pleine.ch

Neuchâtel, le 18.10 à 20h00


vous êtes invité, ce mercredi 18-10-2017 à une conférence / débat aura lieu à l'Espace Louis-Agassiz 1 à 20 heure sale RN.08. Vous trouverez un flyer ci-joint qui décrit l'objet de cette événement.

Cordialement


Jaques Silberstein

<jacques@abstraction.ch>

Qu'est-ce que la monnaie ? Qu'est-ce que le « too big to fail » ? Qu'est-ce que la privatisation des gains et la collectivisation des pertes ? Qui est responsable en dernier recours du CHF ? Le profit de la création monétaire doit-il revenir aux banques ou au peuple Suisse ? L'initiative « monnaie pleine » viendra en votation bientôt. Les enjeux socio-démocratiques liés sont majeurs mais non évidents. Venez assister à la conférence débat le 18 octobre 2017 à 20 heure. Espace Louis Agassiz 1 
Cette conférence est organisée par le comité romand de l'initiative avec la participation des professeurs de l'université de Neuchâtel : Olivier Crevoisier professeur de l'Institut de sociologie Michel Dubois professeur de l' Institut d' Analyse financière Initiative Monnaie Pleine http://www.initiative-monnaie-pleine.ch/


Yverdon: vendredi 3 novembre à 18:30 - 22:00
participer et animer le jeu de la monnaie conjointement avec Matthieu Despont. 


Genève

11 novembre à 10h au Grutli - voir page FB)


DATES

CI-DESSOUS VOUS TROUVEZ UNE LISTE DE MANIFESTATIONS, TRIÉES PAR DATE, EN LIEN AVEC L'INITIATIVE MONNAIE PLEINE.


DATES POUR TOUTE LA SUISSE :

Mercoledì 11 0ttobre 2017
Ore 20:15
Sala Darsena
Parco Ciani Lugano
...lire la suite
Mo. 16. Oktober: 18 Uhr Flyer-Verteilaktion / 19 Uhr Stammtisch-Treff
...lire la suite
17:00 Uhr | Flyerverteil-Aktion
18:00 Uhr | Regiogruppentreffen
...lire la suite
Conferenza organizzata dal Movimento 5 Stelle
Ore 21:00
...lire la suite
09:30 -17:00 | Dorfmärit auf dem Dorfplatz
...lire la suite
10:00-12:00Uhr | Bahnhofplatz
...lire la suite
Sa. 21.10.2017 um 10:30Uhr / Vollgeld-Vortrag bei SP Ortspartei
...lire la suite
18 Uhr - ca. 19 Uhr Flyer-Verteilaktion am Torbogen beim Bahnhof Luzern
19:30 Uhr - 21.30 Uhr geselliges Vollgeld-Treffen für (Neu-)Interessierte
...lire la suite
19:00 Uhr | Haus Oberwilerkurse
...lire la suite
Samstag 28. Oktober | an der STOPP ARMUT KONFERENZ
...lire la suite
12:00-16:00Uhr | Jahrmarkt
...lire la suite
19.00 Uhr | Restaurant HABERHAUS Schaffhausen / (Neu)InteressentInnen willkommen
...lire la suite
08:00 -15:00 | Alten Postplatz
...lire la suite
19:30 Uhr anlässlich der Mitgliederversammlung der Grünen SG
(InteressentInnen willkommen)
...lire la suite
Do. 2. November ab 18 Uhr Stammtisch-Treff: Bitte anmelden...
...lire la suite
Am Montag 6. November 2017 um 19.30 Uhr können Sie sich über die Vollgeld-Initiative informieren!
...lire la suite
19:30 Uhr | Volkshaus
...lire la suite
18 - ca. 21Uhr (offen für alle Interessierte)
...lire la suite
14 - ca. 16 Uhr: in Schaffhausen öffentliche Vollgeld-"Sitzung" (auch für Neuinteressierte)
...lire la suite
19.00 Uhr - 21.00 Uhr | öffentlicher Vollgeld-"Stammtisch" TG / (Neu)InteressentInnen willkommen
...lire la suite
17:00 Uhr | Flyerverteil-Aktion
18:00 Uhr | Regiogruppentreffen
...lire la suite
Ab 19.00 Uhr findet ein Vollgeld-"Regiotreffen" im Friedensrat statt
...lire la suite
10:00-12:00Uhr | Bahnhofplatz
...lire la suite
10:30 - 17 Uhr: Infostand zur Vollgeld-Initiative (und Vortrag)
...lire la suite
Mo. 20. November: 18 Uhr Flyer-Verteilaktion | 19 Uhr Stammtisch-Treffen
...lire la suite
19.00 Uhr | Restaurant HABERHAUS Schaffhausen / (Neu)Interessierte willkommen
...lire la suite
18 Uhr - ca. 19 Uhr Flyer-Verteilaktion am Torbogen beim Bahnhof Luzern
19:30 Uhr - 21.30 Uhr geselliges Vollgeld-Treffen für (Neu-)Interessierte
...lire la suite
19:00 Uhr | Hotel Merian
...lire la suite
18:00Uhr | Flyerverteil-Aktion
19:00Uhr | Stammtisch-Treffen
...lire la suite
19.00 Uhr - 21.00 Uhr | öffentlicher Vollgeld-"Stammtisch" TG / (Neu)InteressentInnen willkommen
...lire la suite
17:00 Uhr | Flyerverteil-Aktion
18:00 Uhr | Regiogruppentreffen
...lire la suite
10:00-12:00Uhr | Bahnhofplatz
...lire la suite
Hier finden Sie ältere Termine und Veranstaltungen.


Les guerres... déterminent la faim

$
0
0

FAO: la faim n’est pas une « maladie incurable », déclare le pape François (traduction complète)

« Les guerres et les changements climatiques déterminent la faim »
Journée mondiale pour l'alimentation 2017, FAO © L'Osservatore Romano
Journée Mondiale Pour L'alimentation 2017, FAO © L'Osservatore Romano
« Les guerres et les changements climatiques déterminent la faim, par conséquent évitons de la présenter comme une maladie incurable », a déclaré le pape François.
Le pape François s’est rendu en visite au siège de la FAO à Rome, ce lundi matin 16 octobre 2017, à l’occasion de la célébration de la Journée mondiale de l’alimentation, consacrée cette année au thème : « Changer l’avenir de la migration. Investir dans la sécurité alimentaire et dans le développement rural. » Il a été accueilli apr le secrétaire général, M. José Graziano da Silva
Il faut, a-t-il dit, « protéger le droit de tous les êtres humains à se nourrir à la mesure de leurs besoins, en participant également aux décisions qui les concernent et à la réalisation de leurs aspirations, sans devoir se séparer de leurs proches ».
Voici notre traduction du discours prononcé en espagnol par le pape François devant les 194 représentants des pays membres de l’Organisation des Nations Unies pour l’alimentation et l’agriculture. Il a été salué par une ovation debout.
HG
Discours du pape François
Monsieur le Directeur Général,
Mesdames et Messieurs les Autorités,
Mesdames et Messieurs,
Je remercie pour l’invitation et pour les paroles de bienvenue du directeur général, le professeur José Graziano da Silva, et j’adresse des salutations chaleureuses aux représentants des États membres et à ceux qui ont la possibilité de se relier à partir des sièges de la FAO dans le monde. Mes salutations particulières vont aux ministres de l’agriculture du G7 ici présents, qui ont conclu leur Sommet au cours duquel ont été discutées des questions qui requièrent une responsabilité non seulement envers le développement et la production, mais aussi à l’égard de la communauté internationale dans son ensemble.
1. La célébration de cette Journée mondiale de l’alimentation nous voit ici réunis pour rappeler ce 16 octobre 1945, quand les gouvernements, décidés à éliminer la faim grâce au développement du secteur agricole, instituèrent la FAO. C’était une période de grave insécurité alimentaire et de grands déplacements de population, avec des millions de personnes à la recherche de lieux où pouvoir survivre à la misère et aux adversités causées par la guerre.
Réfléchir à la façon dont la sécurité alimentaire peut avoir une incidence sur la mobilité humaine signifie donc repartir de l’engagement pour lequel la FAO est née, pour le renouveler. La réalité d’aujourd’hui demande une plus grande responsabilité à tous les niveaux non seulement pour garantir la production nécessaire ou une distribution équitable des fruits de la terre – ceci devrait être acquis – mais surtout pour protéger le droit de tous les êtres humains à se nourrir à la mesure de leurs besoins, en participant également aux décisions qui les concernent et à la réalisation de leurs aspirations, sans devoir se séparer de leurs proches.
Devant un objectif de cette portée, est en jeu la crédibilité de tout le système international. Nous savons que la coopération est toujours plus conditionnée par des engagements partiaux, qui limitent carrément désormais aussi les aides en cas d’urgence. Et pourtant, le fait de mourir de faim ou d’abandonner sa terre est une nouvelle quotidienne qui risque de provoquer l’indifférence. Il est donc urgent de trouver de nouvelles voies pour transformer les possibilités dont nous disposons en une garantie qui permette à chacun de regarder l’avenir avec une confiance fondée et pas seulement avec des désirs.
La scène des relations internationales montre une capacité croissante de donner des réponses aux attentes de la famille humaine, y compris par l’apport de la science et de la technique qui, en étudiant les problèmes, proposent des solutions adéquates. Et pourtant, ces nouveaux objectifs ne réussissent pas à éliminer l’exclusion d’une grande partie de la population mondiale : combien sont les victimes de la malnutrition, des guerres et des changements climatiques ? Combien manquent de travail et des biens essentiels et se voient contraints à quitter leur terre, s’exposant à de nombreuses et terribles formes d’exploitation ? Valoriser la technologie au service du développement est certainement une voie à parcourir, pourvu que l’on arrive à des actions concrètes pour diminuer le nombre des affamés ou pour gouverner le phénomène des migrations forcées.
2. La relation entre faim et migrations ne peut être affrontée que si nous allons à la racine du problème. À ce propos, les études menées par les Nations Unies, ainsi que par de nombreuses Organisations de la société civile, s’accordent à dire qu’il y a deux obstacles principaux à dépasser : les conflits et les changements climatiques.
Comment peut-on surmonter les conflits ? Le droit international nous indique les moyens pour les prévenir ou les résoudre rapidement, évitant qu’ils se prolongent et produisent des famines et la destruction du tissu social. Pensons aux populations meurtries par des guerres qui durent désormais depuis des décennies et qui pouvaient être évitées ou au moins arrêtées et qui, au contraire, propagent leurs effets désastreux, dont l’insécurité alimentaire et le déplacement forcé de personnes. Il faut de la bonne volonté et un dialogue pour freiner les conflits et il faut s’engager à fond pour un désarmement graduel et systématique, prévu par la Charte des Nations Unies ainsi que pour remédier à la plaie funeste du trafic des armes. À quoi sert-il de dénoncer que des millions de personnes sont victimes de la faim et la malnutrition à cause des conflits si l’on ne s’emploie pas efficacement pour la paix et le désarmement ?
Quant aux changements climatiques, nous en voyons tous les jours les conséquences. Grâce aux connaissances scientifiques, nous savons comment il faut affronter les problèmes ; et la communauté internationale a élaboré aussi des instruments juridiques nécessaires comme, par exemple, l’Accord de Paris duquel certains pourtant s’éloignent. Nous voyons réémerger la négligence envers les délicats équilibres des écosystèmes, la présomption de manipuler et de contrôler les ressources limitées de la planète et l’avidité du profit. Il faut cependant un effort pour un consensus concret et actif si l’on veut éviter des effets plus tragiques qui continueront à peser sur les personnes les plus pauvres et les plus sans défense. Nous sommes appelés à proposer un changement dans les styles de vie, dans l’usage des ressources, dans les critères de production jusqu’au biens de consommation qui, en ce qui concerne les aliments, voient des pertes et des gaspillages croissants. Nous ne pouvons pas nous résigner en disant : « les autres y penseront ».
Je pense que ce sont les présupposés de tout discours sérieux sur la sécurité alimentaire liée au phénomène des migrations. Certes, les guerres et les changements climatiques déterminent la faim, par conséquent évitons de la présenter comme une maladie incurable. Les récentes estimations fournies par vos experts prévoient une hausse de la production globale de céréales, à des niveaux qui permettent de donner davantage de consistance aux réserves mondiales. Ceci laisse bien augurer et fait comprendre que les résultats ne manquent pas si l’on agit en étant attentif aux besoins et en empêchant les spéculations. En effet, les ressources alimentaires sont souvent laissées à la merci de la spéculation qui ne les mesure qu’en fonction de la prospérité économique des grands producteurs ou en relation avec le potentiel de consommation et non avec les exigences réelles des personnes. Et c’est ainsi que l’on favorise les conflits et les gaspillages et qu’augmente la file des plus petits de la terre qui cherchent un avenir en dehors de leur territoire d’origine.
3. Devant tout cela, nous pouvons et nous devons inverser la roue (cf. enc. Laudato si’, 63 ;  61 ; 163 et 202). Devant l’augmentation de la demande d’aliments, il est indispensable que les fruits de la terre soient disponibles pour tous. Pour certains, il suffirait de diminuer de nombre de bouches à nourrir et de réduire ainsi le problème ; mais c’est une fausse solution si l’on pense aux niveaux de gaspillage d’aliments et aux modèles de consommation qui gaspillent tant de ressources. Réduire est facile ; partager, en revanche, impose une conversion et ceci est exigeant.
C’est pourquoi je me pose – et je vous pose – cette question : est-ce trop d’introduire dans le langage de la coopération internationale la catégorie de l’amour, déclinée en gratuité, parité dans le traitement, solidarité, culture du don, fraternité, miséricorde ? En effet, ces mots expriment le contenu pratique du terme « humanitaire », si employé dans l’activité internationale. Aimer ses frères et le faire en premier, sans attendre d’être payé en retour : c’est un principe évangélique qui trouve un écho dans de nombreuses cultures et religions et qui devient un principe d’humanité dans le langage des relations internationales. Il est souhaitable que la diplomatie et les Institutions multilatérales alimentent et organisent cette capacité d’aimer, parce que c’est la voie maîtresse qui garantit non seulement la sécurité alimentaire mais la sécurité humaine dans sa globalité. Nous ne pouvons pas œuvrer uniquement si les autres le font, ni nous limiter à avoir pitié parce que la pitié s’arrête aux aides d’urgence, tandis que l’amour inspire la justice et est essentiel pour réaliser un ordre social juste entre des réalités différentes qui veulent courir le risque de la rencontre réciproque. Aimer veut dire contribuer afin que tous les pays augmentent leur production et parviennent à l’autosuffisance alimentaire. Aimer se traduit dans le fait de penser de nouveaux modèles de développement et de consommation, et dans l’adoption de politiques qui n’aggravent pas la situation des populations moins avancées ou leur dépendance extérieure. Aimer signifie ne pas continuer à diviser la famille humaine entre ceux qui ont du superflu et ceux qui manquent du nécessaire.
L’effort de la diplomatie nous a montré, y compris lors d’événements récents, que stopper le recours aux armes de destruction massive est possible. Nous sommes tous conscients de la capacité de destruction de ces instruments. Mais sommes-nous tout aussi conscients des effets de la pauvreté et de l’exclusion ? Comment arrêter des personnes disposées à tout risquer, des générations entières qui peuvent disparaître parce qu’elles manquent du pain quotidien ou qu’elles sont victimes de violence ou des changements climatiques ? Elles se dirigent là où elles voient une lumière ou perçoivent une espérance de vie. Elles ne pourront pas être arrêtées par des barrières physiques, économiques, législatives ou idéologiques : seule une application cohérente du principe d’humanité pourra le faire. Et au contraire, l’aide publique au développement diminue et les Institutions multilatérales sont limitées dans leur activité, tandis que l’on a recours à des accords bilatéraux qui subordonnent la coopération au respect d’agendas et d’alliances particulières ou, plus simplement, à une tranquillité momentanée. Au contraire, la gestion de la mobilité humaine requiert une action intergouvernementale coordonnée et systématique, conduite selon les normes internationales existantes et imprégnée d’amour et d’intelligence. Son objectif est une rencontre entre peuples qui enrichisse tout le monde et qui génère l’union et le dialogue, et non l’exclusion et la vulnérabilité.
Ici, permettez-moi de me relier au débat sur la vulnérabilité qui, au niveau international, divise lorsque l’on parle des migrants. Vulnérable est celui qui est en situation d’infériorité et qui ne peut se défendre, qui n’a pas les moyens, c’est-à-dire qu’il vit une exclusion. Et ceci parce qu’il est contraint par la violence, par des situations naturelles ou, pire encore, par l’indifférence, par l’intolérance et même par la haine. Devant cette situation, il est juste d’identifier les causes pour agir avec la compétence nécessaire. Mais il n’est pas acceptable que, pour éviter de s’engager, on se retranche derrière des sophismes linguistiques qui ne font pas honneur à la diplomatie mais la réduisent, d’un « art du possible » à un exercice stérile pour justifier les égoïsmes et l’inactivité. Il est souhaitable que l’on tienne compte de tout cela dans l’élaboration du Pacte mondial pour une migration sûre, régulière et ordonnée, en cours en ce moment au sein des Nations Unies.
Tendons l’oreille au cri de tant de nos frères marginalisés et exclus : « J’ai faim, je suis étranger, nu, malade, enfermé dans un camp de réfugiés ». C’est une question de justice, non une supplique ou un appel d’urgence. Il faut un dialogue ample et sincère à tous les niveaux pour qu’émergent les situations les meilleures et que mûrisse une nouvelle relation entre les différents acteurs sur la scène internationale, faite de responsabilité réciproque, de solidarité et de communion.
Le joug de la misère généré par les déplacements souvent tragiques des migrants peut être ôté à travers une prévention faite de projets de développement qui créent du travail et une capacité de réponse aux crises climatiques et environnementales. La prévention coûte bien moins que les effets provoqués par la dégradation des terrains ou par la pollution des eaux, effets qui frappent les zones névralgiques de la planète où la pauvreté est la seule loi, les maladies sont en augmentation et l’espérance de vie diminue.
Nombreuses et louables sont les initiatives mises en œuvre. Cependant, elles ne suffisent pas ; il est nécessaire et urgent de continuer à faire des efforts et à financer des programmes pour affronter de manière encore plus efficace et prometteuse la faim et la misère structurelle. Mais si l’objectif est de favoriser une agriculture qui produise en fonction des exigences effectives d’un pays, alors il n’est pas licite de soustraire les terres cultivables à la population, en laissant le « land grabbing » (l’accaparement des terres) continuer de faire son profit, peut-être avec la complicité de ceux qui sont appelés à veiller à l’intérêt du peuple. Il faut éloigner les tentations d’agir au profit de groupes restreints de la population ou d’utiliser les apports extérieurs de manière inadéquate en favorisant la corruption ou en l’absence de légalité.
L’Église catholique, avec ses institutions, ayant une connaissance directe et concrète des situations à affronter et des besoins à combler, veut participer directement à cet effort en vertu de sa mission qui la pousse à aimer tout le monde et qui l’oblige aussi à rappeler à ceux qui ont des responsabilités nationales et internationales, leur devoir plus large de partager les nécessités des plus pauvres.
Je désire que chacun découvre, dans le silence de sa foi ou de ses convictions, les motivations, les principes et les apports pour donner à la FAO et aux autres Institutions intergouvernementales, le courage d’améliorer et de persévérer pour le bien de la famille humaine.
Merci !
© Traduction de Zenit, Hélène Ginabat

La dignité de l’enfant

$
0
0

Déclaration de Rome : «La dignité de l’enfant dans le monde numérique»

Traduction intégrale en français
Dignité de l'enfant, 6 oct. 2017 © L'Osservatore Romano
Dignité De L'enfant, 6 Oct. 2017 © L'Osservatore Romano
Le pape François a reçu en audience les participants du premier congrès intitulé « La dignité de l’enfant dans le monde numérique » – « Child Dignity in the Digital World » – , vendredi 6 octobre 2017, au Palais apostolique du Vatican.
Le congrès a été promu et organisé par le Centre de protection de l’enfance de l’Université pontificale grégorienne à Rome, du 3 au 6 octobre 2017.
Le pape a apporté son soutien « avec grande résolution et avec élan les engagements » des participants exprimés dans la Déclaration finale.
Voici notre traduction, de l’italien, de cette déclaration également publiée en anglais et en espagnol.
AB
Déclaration de Rome
Pape François : « De la manière dont on traite les enfants on peut juger une société »
La vie de chaque enfant est unique, importante et précieuse, et chaque enfant a le droit à la dignité et à la sécurité. Cependant, aujourd’hui, la société mondiale est en train de faillir profondément dans la protection de ses enfants. Des millions de mineurs sont abusés et exploités de la manière la plus tragique et la plus indescriptible dans le monde, à une échelle sans précédent.
Les progrès technologiques exponentiels et leur intégration dans notre vie quotidienne ne sont pas en train de changer seulement ce que nous faisons et comment nous le faisons, mais ils sont en train de changer ce que nous sommes. Une grande partie de l’impact de ces changements a été définitivement positif. Cependant, nous devons affronter un côté obscur de ce nouveau monde, un monde qui est en train de rendre possible un grand nombre de méfaits sociaux capables de blesser les membres les plus vulnérables de la société.
Alors qu’il est hors de doute qu’Internet crée de nombreux bienfaits et de multiples opportunités en termes d’inclusion sociale et de niveau d’instruction, à ce jour des contenus toujours plus extrêmes et déshumanisants sont pratiquement à portée de main des enfants. La prolifération des réseaux sociaux qui ne comportent que des actes insidieux comme la cibervoyoucratie, le harcèlement et les extorsions sexuelles sont en train de devenir toujours plus communs. Dans sa spécificité, l’ampleur et la portée des abus sexuels sur des mineurs et de l’exploitation en ligne est bouleversante. Un très grand nombre d’images d’abus sexuels sur des enfants et des jeunes est disponible en ligne et croît sans cesse.
L’impact délétère de la pornographie sur l’esprit malléable des enfants est un autre dommage auquel les réseaux les exposent.
Nous, nous partageons la vision d’un Internet qui soit accessible à tous. Toutefois nous croyons qu’elle doit comprendre aussi la reconnaissance de la valeur non négociable de la protection de tous les mineurs.
Il s’agit de défis énormes, mais nous ne pouvons pas nous laisser abattre ni décourager. Nous devons travailler ensemble afin de chercher des solutions positives pour tous, capables de promouvoir la responsabilité de chacun. Nous devons nous assurer que tous les mineurs aient un accès sécurisé à Internet, afin d’enrichir leur formation, leurs communications et leurs relations.
Les entreprises qui travaillent dans l’environnement des nouvelles technologies et les gouvernements ont pris un rôle directeur dans cette bataille et ils doivent accomplir des innovations continues pour garantir une meilleure protection des mineurs. Nous devons aussi solliciter les familles, le voisinage, la communauté de toutes les parties du monde et leurs enfants afin qu’ils soient plus conscients de l’impact exercé par Internet sur les mineurs.
Nous disposons déjà de plateformes puissantes et de d’opérateurs importants au niveau mondial qui sont en train d’accomplir des progrès significatifs pour la réalisation de ces aspirations. Le Centre for Child Protection de l’Université Pontificale Grégorienne met en avant un travail international en faveur de la protection dans 30 pays et 4 continents. WePROTECT Global Alliance, fondée au Royaume Uni, en collaboration avec l’Union Européenne et les Etats Unis, réunit dans cette lutte 70 nations, 23 entreprises technologiques et de nombreuses organisations internationales.
Les Nations Unies sont à la tête d’un effort mondial afin de rejoindre l’Objectif pour le Développement Durable 16.2, pour éradiquer la violence contre les enfants avant 2030, en particulier à travers le partenariat mondial « End Violence Against Children ».
Il s’agit d’un problème qui ne peut être résolu par une nation, une entreprise ou une religion toute seule, c’est un problème global qui nécessite des solutions globales. Cela demande que nous construisions une acceptation diffuse et que nous mobilisions pour des actions tous les gouvernements, toutes les fois religieuses, toutes les entreprises et institutions.
La Déclaration de Rome lance un appel à agir :
1 – Aux autorités mondiales, afin qu’ils entreprennent une campagne globale de sensibilisation pour éduquer et informer les personnes dans le monde par rapport à la gravité et à l’extension de l’abus et de l’exploitation des enfants du monde entier, et pour les pousser à demander des interventions aux dirigeants nationaux.
2 – Aux autorités des grandes religions du monde, afin qu’elles informent et mobilisent les disciples de toutes les fois religieuses afin qu’elles s’unissent dans un mouvement global pour protéger les enfants du monde.
3 – Aux parlements du monde entier, afin qu’ils améliorent la législation pour une protection plus efficace des mineurs et appellent ceux qui se rendent responsables de l’abus et de l’exploitation des enfants, à rendre compte de leurs crimes.
4 – Aux dirigeants des entreprises technologiques, afin qu’ils s’engagent à développer et mettre en place de nouveaux outils et des technologies afin de contrer la prolifération d’images d’abus sexuels sur Internet et empêcher la redistribution des images des mineurs identifiés comme victimes.
5 – Aux ministères de la santé publique du monde et aux dirigeants des organisations non gouvernementales, afin qu’elles augmentent les actions pour sauver les victimes les plus jeunes et améliorent les programmes de soin pour les victimes d’abus et d’exploitation sexuelle.
6 – Aux agences gouvernementales, à la société civile et les forces de l’ordre, afin qu’elles travaillent pour améliorer la reconnaissance et l’identification des victimes, et assurent de leur aide vers le nombre énorme d’abus et d’exploitation sexuels sur les mineurs encore cachés.
7 – Aux forces de l’ordre du monde, afin qu’ils augmentent la capacité locale et mondiale, afin d’améliorer l’échange d’informations dans le domaine des investigations et augmentent les efforts de collaboration quant aux crimes contre les mineurs qui traversent les frontières nationales.
8 – Aux institutions médicales du monde, afin qu’elles augmentent la formation des professionnels de santé pour l’identification des indicateurs d’abus et d’exploitation sexuels et améliorent les modalités d’information et de soin.
9 – Aux institutions privées et gouvernementales, afin qu’elles augmentent les ressources pour les professionnels dans le domaine psychiatrique et les experts dans les autres types de soins, de manière à augmenter les services de soin et de réhabilitation pour les enfants qui sont abusés et exploités.
10 – Pour les autorités ayant des responsabilités dans le domaine de la santé publique, afin qu’elles promeuvent la recherche sur l’impact que l’exposition à la pornographie explicite et extrême en ligne exerce sur la santé des enfants et adolescents.
11 – Aux dirigeants des gouvernements du monde entier, aux corps législatifs, aux industries privées et aux institutions religieuses, afin qu’elles promeuvent et réalisent des techniques afin d’empêcher les enfants et les jeunes d’avoir accès aux contenus Internet où doit pouvoir accéder seulement un public adulte.
12 – Aux gouvernements, aux industries privées et aux institutions religieuses, afin qu’ils entreprennent des campagnes mondiales de sensibilisation adressées aux enfants et aux jeunes, pour les former et leur fournir les instruments nécessaires pour une utilisation sûre et responsable d’Internet et pour éviter que soit fait du mal une foule de leur âge.
13 – Au gouvernements, aux industries privées et aux institutions religieuses, afin qu’elles entreprennent des initiatives globales de sensibilisation afin de rendre les citoyens de tous les pays plus attentifs et conscients par rapport aux abus et à l’exploitation sexuelle des mineurs, afin qu’ils les encouragent à signaler les cas d’abus et ‘exploitation aux autorités compétentes, quand ils voient, ont connaissance ou aient des suspicions que cela arrive.
Dans cette ère de l’Internet, le monde affronte des défis sans précédents afin d’encadrer les droits de la dignité des enfants et les protéger de l’abus et de l’exploitation. Ces défis requièrent une nouvelle manière de penser et de nouvelles approches, une conscience plus élevée au niveau mondial et un leadership inspiré. Pour cette raison, cette Déclaration de Rome fait appel à tous, afin que tous se lèvent pour la défense de la dignité des mineurs.
Présentée ce jour le 6 octobre 2017
© Traduction de ZENIT, Hugues de Warren

Panama Papers journalist killed

$
0
0


Car bomb kills crusading Panama Papers journalist in Malta

Center CEO, John Dunbar, condemns attack, demands thorough investigation

News sources today are reporting the tragic death of Daphne Caruana Galizia, a journalist who led the Panama Papers investigation into corruption in Malta.

Caruana Galizia, 53, was reportedly killed in a car bombing near her home. Local media reports indicated that in recent days she had filed a police report complaining of death threats.

Caruana Galizia was a fearless journalist and blogger who exposed numerous offshore dealings of prominent figures in Malta. She was also the mother of International Consortium of Investigative Journalists (ICIJ) developer and data journalist Matthew Caruana Galizia.

The Center for Public Integrity spun off ICIJ earlier this year. John Dunbar, CEO of the Center condemned the attack, saying it was “not only a tragic killing of a courageous journalist but an attack on the profession as a whole. This must not go unpunished.”

ICIJ released a statement condemning the attack:

“ICIJ condemns violence against journalists and is deeply concerned about freedom of the press in Malta,” wrote its director, Gerard Ryle. “ICIJ calls upon the Maltese authorities to investigate the murder and bring the perpetrators to justice. ICIJ’s thoughts are with the Caruana Galizia family at this time.”

No group or individual has come forward to claim responsibility for the attack according to news accounts at this writing.


#demandpressfreedom

#demandfreepress

#wedemandfreepress

#wedemandpressfreedom


Le système bancaire est une pyramide de Ponzi

$
0
0

Banques: quelques faits et vérités

mais un Roi grugé par des banquiers et des politiciens... 
Ils nous mentent à tous et tout le temps...
La démographie devenue récessive face aux intérêts exponentiels verticaux va aggraver les crises !

Graphique tiré du livre: Europe, l'hiver démographique, édité à l'Age d'Homme, Lausanne et Paris


Europe, l'hiver démographique

https://books.google.ch/books?isbn=2825100056
1989 - ‎Europe
La création de l'Institut Suisse de Démographie et de Développement, ISDD, dont ... éditions l'Aged'Homme grâce auxquelles a été rendue possible la diffusion ...

François de Siebenthal: Monde, l'hiver démographique :

desiebenthal.blogspot.com/2010/03/monde-lhiver-demographique.html

18 mars 2010 - Le livre: " Europe: l'hiver démographique" en parlait déjà en 1989. ( Edition l'aged'homme, ... Editeur : Lausanne : L'Âge d'homme. Année de ...

La solution ?

http://desiebenthal.blogspot.ch/2017/09/monnaie-pleine-bases-de-discussion.html
Donner à chacun ce qui lui est dû par un dividende social à tous!


Présentement, les habitants de pratiquement chaque pays sur terre, mais surtout ceux des pays occidentaux et autres "démocraties" et "États de Droit", font face à une montée croissante de la répression étatique parallèle à la prise de conscience globale par ces mêmes populations de la monumentale arnaque et crime contre l'Humanité de la création monétaire privée au profit des Banksters.

Cette arnaque est à la source de tous les autres symptômes de corruption généralisée observables au sein de nos sociétés dites "modernes".

Partout, la situation est la même : l'État use et abuse de son prétendu "pouvoir souverain" face auquel le citoyen lambda est habituellement dépourvu d'arguments, confronté à un appareil légal et électoral qui à prétention de légitimer ce même "pouvoir souverain" par l'autorité de la Démocratie et de l'État du Droit, valeurs nobles et incontestables, et ce peu importe si ce citoyen lambda a voté ou non.

C'est la mise en place d'une véritable "Dictature du Peuple, par le Peuple, pour le Peuple", en quelque sorte.

Pourtant, ce que l'État ne vous dit pas, c'est que l'appareil légal indique que c'est vous, chaque individu citoyen qui formez le Peuple, qui le détenez, ce "pouvoir souverain", cette "légitimité" sur laquelle se fonde toute démocratie qui se respecte, qu'elle soit "représentative" ou "directe", et qu'en tant que tel, vous n'avez pas à être soumis à votre gouvernement pour avoir le droit d'exister et de vivre en paix.
En voici la preuve, conformément aux principes du Droit International et démontré à l'aide des lois et législations en vigueur au Québec.
Ceci est également observé à travers l'ensemble des pays anglo-saxons, peu importe le régime politique propre à chaque pays.
Il est donc fortement conseillé à l'auditeur francophone ..., de porter soin aux principes généraux énoncés au sein de des vidéos ci-dessous et ensuite d'effectuer ses propres recherches ...
L'oeil averti y reconnaîtra sûrement une référence avec les fameux secrets maçonniques et leur symbologie pyramidale particulière quant à ce système dont les origines sont très sûrement liées de près avec les Lumières, d'où sont issues les Droits de l'Homme et la République Française.
Ce n'est sûrement pas le fruit du hasard.

Démocratie économique: étude par 9 théologiens La démocratie ...

https://plus.google.com/117421548238726599207/posts/aZfdbQo8bPp

1 sept. 2017 - La démocratie économique, alias crédit social, est notamment en accord avec la doctrine sociale de l'Église catholique, avec plusieurs églises protestantes ( son ...

François de Siebenthal: Tous vivre dans l'abondance par le crédit social.

https://desiebenthal.blogspot.com/2016/04/tous-vivre-dans-labondance-par-le.html?...

27 avr. 2016 - Le crédit social est une doctrine économique et un mouvement social qui est apparu au début des années 1920. À l'origine, c'était une théorie ...

De la Vallée des 7 - Confessions d'un banquier Suisse - Entrevue ...

https://vimeo.com › AIDEF Télé › Videos
10 nov. 2016 - Ajouté par AIDEF Télé
... banquier Suisse François de Siebenthal, un défenseur du concept d'une réforme monétaire mondiale connue ...

François de Siebenthal: Krach, appel à témoins pour passer à la TV ...

desiebenthal.blogspot.ch/2008/09/krach-appel-tmoins-pour-passer-la-tv.html

Krach, appel à témoins pour passer à la TV, urgent...et nos emplois et nos retraites ? La seule solution sérieuse, le crédit social. Débat du 23 septembre 2008 à ...

Crédit social — Wikipédia

https://fr.wikipedia.org/wiki/Crédit_social

Des informations de cet article ou section devraient être mieux reliées aux sources mentionnées dans la bibliographie, sources ou liens externes (mars 2012).
Sources, références et compléments :
"Un banquier suisse explique en 3 minutes l'arnaque de la création monétaire, avec le Canada comme exemple."
Vidéo Facebook :
https://www.facebook.com/LePeupleEstRoi/videos/vb.152656254942354/398971633644147/?type=3&theater
Vidéo YouTube :
https://www.youtube.com/watch?v=5BzfLG-tM7Q
Vidéo Google + :
https://plus.google.com/…/10904608785769…/posts/QgPD3M1ec8y…
Version de 36 minutes :
"Un banquier suisse explique en 36 minutes l'arnaque de la création monétaire."
http://desiebenthal.blogspot.ch/…/comment-creer-la-monnaie-…
https://www.youtube.com/watch?v=dmwtBcU0qtA
Avec François de Siebenthal
Tiré de l'émission "Qu'est-ce qu'elle a ma girl" de becurioustv.com.
Montage de Adam Richard pour AIDEF-Télé
--- Vidéo repris par Quenel+ via News360x.fr :
http://quenelplus.com/…/un-banquier-suisse-explique-en-3-mi…
:-) (Y)
________________________________
À voir :
Survol rapide de la plus grande fraude fiscale à survenir au Canada au détriment du Peuplehttps://www.facebook.com/groups/1592518277651702/1658780451025484/?ref=notif&notif_t=group_activity

, et qui est utilisée régulièrement dans les médias traditionnels pour justifier les mesures d'austérité, les hausses de tarifs et les coupures dans les services sociaux. Explications simples basées sur des réalités historiques démontrant hors de tout doute raisonnable l'origine réelle de la dette publique et des coupures budgétaires que celle-ci génère.
____________
- Le Pouvoir Souverain du Peuple : Les fondements légaux de l'État Démocratique et de Droit

AIDEF-Télé Épisodes ''Le Peuple est Roi!''
https://www.youtube.com/playlist…
Le Peuple Est Roi - Épisode 3 - Le Pouvoir Souverain du Peuple
https://www.youtube.com/watch?v=s6r_uSIGJFw
Comment faire sauter un ticket sans se fatiguer
http://particitoyenduquebec.blogspot.ca/…/comment-faire-sau…
La Loi, le Gouvernement et Vous
https://www.youtube.com/watch?v=nnScEVFjxBw
Mise en demeure d'où est tirée la démonstration en 21 points contenue dans le vidéo, avec liens vers les sources de références
http://particitoyenduquebec.blogspot.ca/…/mise-en-demeure-c…
Austérité - Le Grand Mensonge Néolibéral
https://www.youtube.com/watch?v=Ukd--cPR3BY
L'Empire contre-attaque : Quelle mouche a piqué Jacques-Antoine Normandin?
https://www.youtube.com/watch?v=BA0EUY1iIiU


Principaux clients de Madoff[modifier | modifier le code]

Plus de vingt investisseurs avaient des enveloppes de plus de cent millions de dollars investis dans les entreprises de Madoff au moment de la révélation de l'escroquerie30,31,32.
Les pertes de plus d'un milliard de dollars :
NomPerte en milliards (USD)
Fairfield Greenwich Advisors7,50
Kingate Management3,50
Tremont Capital Management3,30
Banco Santander3,10
Bank Medici2,10
Ascot Partners1,80
Access International Advisors1,40
Fortis Bank Nederland1,40
Union bancaire privée (UBP)1,00
HSBC1,00
Les pertes comprises entre 100 millions et 1 milliard USD incluent Natixis SA, Carl J. Shapiro, Royal Bank of Scotland Group PLCBNP ParibasBBVAMan Group PLC, Reichmuth & Co., Nomura HoldingsMaxam Capital Management, EIM SA, et AXA SA. Il y aurait également 23 pertes potentielles comprises entre 1 et 100 millions de dollars.
La société d’audit Alix Partners, chargée de la procédure de faillite de la société Bernard Madoff Investment Securities LLC, a compilé une liste des clients de Bernard Madoff et de clients qui se sont déclarés auprès du Securities Investor Protection Corporation (SIPC)33.
Le 20 février 2009, le liquidateur de la société de Madoff a annoncé avoir retrouvé 650 millions USD34. Au 17 décembre 2010, ce sont 10 milliards qui ont été récupérés, 7,2 milliards provenant de la fortune de Jeffry Picower décédé en octobre 200935.
D’après le New York Times, 15,5 milliards de dollars auraient été remboursés par les banques à leurs 720 000 investisseurs hors des États-Unis, correspondant à l'ensemble des fonds investis hors intérêts36.

Les complices et les bénéficiaires[modifier | modifier le code]

Irving Picard, l’administrateur judiciaire chargé de liquider la société de Bernard Madoff estime à environ 2 000 le nombre de personnes ou entreprises qui ont gagné de l’argent grâce à Madoff et en a accusé environ 1 000 d’avoir profité indûment de ce système, parmi eux la famille L. qui a négocié un arrangement de 220 millions de dollars37,38,39Carl J. Shapiro (en) et sa famille qui vont restituer 625 millions de dollars40 et la banque suisse UBP avec qui un accord de recouvrement pour un montant de 500 millions de dollars avait été passé.
Le , le procureur fédéral de New York, Preet Bharara (en), a annoncé qu'un accord avait été trouvé avec les héritiers de Jeffry Picower (en), l'un des principaux bénéficiaires de l'escroquerie et complice de Madoff selon un rapport du syndicat de faillite, pour restituer les 7,2 milliards de dollars demandés par Picard41.
Irving Picard a déclaré que « Madoff n'a pas agi seul pour commettre la plus grande escroquerie financière de l'histoire », il a annoncé qu'il réclamait 6,4 milliards de dollars à la banque américaine JPMorgan Chase, principale banque du fonds de Bernard Madoff, 2,5 milliards de dollars à la banque suisse UBS42 et neuf milliards de dollars à la banque Hong-Kongaise HSBC43. Il a également porté plainte contre Citigroup concernée à hauteur de 425 millions de dollars, BNP Paribas pour environ 400 millions de dollars, Capital ResearchABN AMROBBVANomuraMerrill LynchOppenheimer Acquisition Corp (en)Vontobel Asset ManagementPictet & CieLombard Odier, Legacy Capital, le groupe Tremont, la MassMutual Holding LLCNotz & Stücki, la banque israélienne Bank Hapoalim, la société de gestion suisse Genevalor Benbassat & Cie ainsi que 4 membres de la famille de Madoff à qui il est demandé au total 198,74 millions de dollars et deux dirigeants de fonds rabatteurs, Frank Avellino et Michael Bienes qui ont géré le premier fonds rabatteur de BLMIS alimentant le début de la fraude pyramidale, plusieurs membres de leurs familles et des fonds d'investissement qu'ils contrôlaient pour recouvrer 900 millions de dollars44,45,46,47.
Paul K. (77 ans), l'ancien comptable, est la quinzième personne à faire l'objet d'accusations (dissimulation d'opérations comptables). Il plaidera « non coupable » comme les cinq autres anciens employés de Madoff. Leur procès se déroule le 7 octobre 2013 à New York48.
En tout, le liquidateur aura déposé plus de mille plaintes civiles, pour un montant avoisinant les 50 milliards de dollars49.

Le dossier Kohn[modifier | modifier le code]

Irving Picard soupçonne la banquière autrichienne Sonja Kohn d'être la complice principale de Madoff, « En Sonja Kohn, Madoff a trouvé une âme sœur criminelle, dont l'avidité et l'inventivité malhonnête égalaient la sienne », a t-il déclaré50.
Elle est accusée d'avoir « pendant plus de vingt ans, orchestré une vaste machination illégale »« M. Madoff payait Mme Kohn qui rabattait l'argent de ses clients vers le fonds de M. Madoff, qui la payait secrètement en retour »51.
Dans la plainte centrée sur Sonja Kohn, Picard lui réclame 9,1 milliards de dollars de dommages et intérêts ainsi que 10,5 milliards à la banque qu'elle a fondée, à la banque italienne Unicredit, à sa filiale Bank Austria et à 53 autres personnes et entités.
« Compte tenu de l'étendue du montage Ponzi de Madoff, de la nature trompeuse des accusés et de la structure délibérément byzantine de Medici Enterprise, nous pensons que seront révélées encore plus d'informations relatives à l'ampleur réelle de cette entreprise criminelle », ajoute-t-il.

Peter Madoff[modifier | modifier le code]

Le 20 décembre 2012, Peter Madoff, 67 ans, est condamné à dix ans de prison pour avoir falsifié les comptes de l'ancienne société d'investissement familiale de son frère Bernard Madoff - de 7 ans son aîné - dans laquelle il travaillait comme « gardien des comptes », et il est dépossédé d'à peu près tous ses avoirs52.

Coût des frais d'avocats[modifier | modifier le code]

La Securities Investor Protection Corporation (SIPC), une organisation parrainée par l'industrie qui offre une protection financière aux investisseurs, a versé en deux ans plus de 290 millions de dollars à des cabinets d'avocats et des consultants depuis que l'empire Madoff s'est écroulé en 2008. Les avocats et les consultants sont chargés de traquer et de recouvrer des avoirs volés par Madoff afin qu'ils puissent être redistribués aux victimes de son escroquerie.
Ceci inclut les frais d'environ de 128 millions de dollars pour Baker & Hostetler, le cabinet d'avocats qui est à la tête de la récupération des biens volés. L'entreprise Irving Picard, qui a été nommée pour servir en qualité de fiduciaire par le tribunal fédéral des faillites supervisant l'affaire, a eu un montant supplémentaire de 3,2 millions. Le SIPC indique qu'il a déboursé 10 millions de dollars supplémentaires à des cabinets d'avocats dans le monde entier.
En outre, l'organisation a versé près de 150 millions à des consultants, dont 84 590 786,44 $ pour FTI Consulting chargée de localiser les actifs détournés par Madoff qui espère en recevoir deux fois plus dans les prochaines années53, 48 millions de dollars à AlixPartners, 2,5 millions de dollars à Associates Renaissance et 10 millions de dollars à d'autres consultants54.

Médias, indépendance ou influence ?

$
0
0


Freysinger-Jeannet : L'indépendance des médias. La Vidéo !


Débat entre MM. Oskar Freysinger et Alain Jeannet sur l'indépendance des médias et sous la férule débonnaire de M. Guy Mettan, directeur du club suisse de la presse.
Un Oskar Freysinger très en verve devant un public conquis et un Alain Jeannet faisant front avec plus que du courage.
Introduction, M. Adrien de Riedmatten, coordinateur romand.
Allocution finale, M. le Conseiller national Luzi Stamm, vice-président de l'ASIN.
Vendredi 13 octobre 2017, dès 19h30, Château d'Aigle, Salle des Excellences.


#demandpressfreedom

#demandfreepress

#wedemandfreepress

#wedemandpressfreedom


Fatima, les 3 secrets.

$
0
0


Demain 
Sur KTO à 13:20

Regarder KTO en direct à la télévision ...


À l'occasion du centenaire de la fin des apparitions, le 13 octobre 1917


En 1917, trois enfants disent avoir eu plusieurs apparitions de la Vierge Marie qui leur a annoncé à l'avance et à des dates précises, des faits qui bouleverseront tout le Portugal.

Le 13 octobre 1917, plus de 70 000 témoins ont assisté à l'évènement résolument surnaturel du soleil tournoyant sur lui-même comme un disque d'argent et se rapprochant au plus près de la foule.

Cet incident a été vu à plus de 900 km à la ronde.

Alors qu'en est-il ? Supercherie ? Hallucinations? Ou véritable fait miraculeux d'origine divine?


Réalisé par Ian HigginsDominic Higgins


Quels sont les trois secrets de Fatima ?


La rédaction d'Aleteia |  2017


© Public domain


Les trois pastoureaux de Fatima


Le message délivré par la Vierge Marie aux trois pastoureaux se décline en trois secrets, révélés au fil des années. S'ils nourrissent les spéculations des amateurs d'ésotérisme les plus farfelus, ils sont aussi et surtout au centre de l'attention des plus grands théologiens.


Le 13 juillet 1917, lors de sa troisième apparition devant Jacinthe, François et Lucie — les trois petits bergers de Fatima— la Vierge Marie délivre un message essentiel contenant trois secrets. Les enfants sont priés de ne pas le divulguer dans l’immédiat. François et Jacinthe meurent peu après les apparitions, respectivement en 1919 et 1920. Lucie, devenue religieuse, demeure la seule détentrice de la révélation et de ses trois secrets qu’elle couche progressivement sur le papier. Ce n’est qu’en 1941 que les deux premiers secrets sont révélés — avec l’autorisation de la Sainte Vierge — tandis qu’il faudra attendre 2000 pour connaître la contenu du troisième sous l’impulsion de saint Jean Paul II.
Premier secret de Fatima : la vision de l’enfer


La Vierge Marie aurait fait voir aux bergers de Fatima une vision très nette de l’enfer. Dans son témoignage, Lucie évoque une mer de feu souterraine, des démons et des âmes dévorés par les flammes, des hurlements de terreur et de douleur. Lors de sa première apparition, Marie avait annoncé aux enfants qu’Elle les emmènerait au ciel. « Autrement, je crois que nous serions morts d’épouvante et de peur » précise Lucie dans son témoignage écrit. Pour sauver les âmes promises à l’enfer, la Sainte Vierge préconise une solution : « Établir dans le monde la dévotion à (S)on cœur immaculé ».
Deuxième secret de Fatima : la consécration de la Russie


La deuxième partie du message du 17 juillet montre l’attention que porte la Vierge aux tragédies temporelles de l’humanité. Alors que la Première Guerre mondiale met l’Europe à feu et à sang, elle annonce une guerre « pire encore ». Pour éviter cette guerre annoncée, Marie demande la « consécration de la Russie à (S)on cœur immaculé et la communion réparatrice des premiers samedis ». On sait ce qu’il en fut. Néanmoins, la Vierge achève cette deuxième partie du message par une note d’espérance. La Russie finira par être consacrée, elle se convertira, et l’humanité bénéficiera d’une période de paix.
Troisième secret de Fatima : une vision apocalyptique ?


L’ultime partie du message de Fatima est la plus complexe et la plus controversée. Lucie décrit notamment une « montagne escarpée » gravie par un évêque vêtu de blanc — sans doute le pape ? — qui meurt à son sommet, où se dresse une croix en bois brut. À sa suite, d’autres évêques, des prêtres, des religieux et religieuses, des laïcs, y périssent à leur tour. Saint Jean Paul II considéra que cette vision annonçait l’attentat dont il fut victime le 13 mai 1981 place Saint-Pierre à Rome. En 2000, il dépêcha le cardinal Bertone auprès de sœur Lucie pour approfondir encore cette interprétation. Le cardinal Ratzinger et futur Benoît XVI, qui se penche aussi sur le secret, y voit fondamentalement un appel à la pénitence et la promesse de la victoire finale du cœur immaculé de Marie.


La retranscription précise du témoignage de Sœur Lucie figure sur le site du Vatican.

Journaliste & blogger Daphné Caruana Galizia assassinée

$
0
0


Sur Twitter, le fondateur de WikiLeaks, Julian Assange, a promis une récompense de 20'000 euros pour toute information menant à la condamnation des assassins.


Agée de 53 ans, Caruana Galizia tenait un blog extrêmement populaire dans lequel elle dénonçait sans relâche des affaires de corruption impliquant des responsables politiques de l'île méditerranéenne. Elle était notamment à l'origine d'accusations de corruption qui avaient provoqué des élections anticipées en juin.
Gouvernement accusé de complicité
La police a déclaré qu'elle avait été tuée par l'explosion d'une bombe sous sa voiture alors qu'elle roulait près du village de Bidnija, dans le nord de Malte.
Le fils de la blogueuse, Matthew Caruana Galizia, a accusé mardi le gouvernement maltais de complicité dans ce meurtre. «Vous êtes complices, vous êtes responsables de ça», a lancé sur Facebook ce membre du Consortium international des journalistes d'investigation (ICIJ) à l'adresse des autorités.
Il s'en est pris au Premier ministre travailliste Joseph Muscat et à son entourage, les accusant d'avoir rempli le gouvernement, la police et les tribunaux d'«escrocs».
«Un WikiLeaks en une seule femme»
Lundi soir, des milliers de personnes se sont spontanément rassemblées, bougies à la main, à Sliema, près de La Valette, pour une veillée en hommage à l'ancienne journaliste devenue, selon le magazine Politico, «un WikiLeaks entier en une seule femme».

Sur Twitter, le fondateur de WikiLeaks, Julian Assange, a promis une récompense de 20'000 euros pour toute information menant à la condamnation des assassins.


#demandpressfreedom

#demandfreepress

#wedemandfreepress

#wedemandpressfreedom


Pouvoir d'achat, un manque chronique à corriger !

$
0
0

Ci-dessous, cet article de Olivier Heydorn sur l'analyse des coûts qui, dans le processus actuel de production-distribution, fausse complètement le pouvoir d'achat du plus grand nombre et empoisonne au sens strict la vie économique et sociale du monde entier. La mondialisation ne fait que répandre sans limite l'intoxication financière létale. 

Deus in Adjutorium

R. L.

Crédit Social, analyse du coûtd'après Olivier Heydorn (Canada) (adapté en français par Renaud  L a i l l i e r)

Dans un souci de simplicité, l'acte d'accusation de l'"ordre"économique actuel par rapport au Crédit-Social ou son équivalent exact la Démocratie Économique, pourrait se résumer ainsi: le système financier n'est pas auto-liquidable. La plupart des échanges économiques ne sont jamais à solde = 0.

Si l'on conçoit le système financier, qui est principalement composé des systèmes bancaires et de comptabilité analytique, comme une sorte de recouvrement fait par un logiciel informatique qui lit et représente des faits et des actes économiques physiques en mesurant l'activité économique, l'idée de base du Crédit-Social (ou de la Démocratie-Économique c'est pareil) est d'équilibrer automatiquement l'accumulation de - tous - les prix à payer d'une part, pour:
A) la consommation quotidienne nécessaire à la vie, donc à la survie de chacun et de tous dans la société (alimentation et eau potable, énergie, logement, vêtements, enseignement et instruction, santé, etc) 
ET d'autre part, pour:
B) la consommation nécessaire à toute la production (les matières premières, leur extraction, transports, fabrications avec tous les approvisionnements que cela nécessite en biens et services de fabrications, etc,). Ceci donne une 
consommation totale formée de l'addition de la consommation des besoins de chacun et de toute la société pour survivre et vivre, à laquelle s'ajoute toute laconsommation nécessaire à la production de tous les biens (bien de capital, machines, etc) servant donc à fabriquer les biens et les services à consommer. 
C'est ainsi que pour la distribution du revenu, le logiciel doit être conçu pour générer un flux de coûts et donc de prix accumulés au cours de la production générale de tout bien ou service ayant été produit. On sait maintenant, car plusieurs fois confirmés (dans les conditions actuelles) que ces coûts dépassent nécessairement le pouvoir d'achat du consommateur. Ce pouvoir d'achat qui est, en même temps que le processus de production, versé sous forme de salaires (auxquels pourrait s'ajouter un dividende); au passage, ça marche depuis très longtemps dans le capitalisme le plus classique avec l'actionnariat, pourquoi ça ne marcherait pas dans le domaine de la production physique et les gains de productivité? (j'ai des exemples parfaitement probants) et, au passage encore, il faut penser au revenu de base individuel garanti provenant des gains de productivité historiques et d'actualité; les inventeurs et les prêteurs ayant reçu leur récompenses légitimes. Cela devrait permettre la monétisation progressive de tous progrès techniques (et ne pas oublier que, désormais, nous comprenons qu'un progrès est vraiment un progrès, que s'il tend à un dommage minimum, idéalement vers 0, à l'environnement et à l'écosystème, sinon, à terme, on resterait comme maintenant à polluer sans limite).

Il résulte de la situation actuelle un manque chronique de pouvoir d'achat des consommateurs vis-à-vis des biens et services offerts, c'est-à-dire du pouvoir d'achat qui n'est pas délivré de l'hypothèque bancaire sur les futurs revenus ...

Un système financier autofinancé maintiendrait toujours les prix et les revenus des consommateurs en équilibre automatique. De sorte que l'acte de produire un volume déterminé de biens et de services distribuerait toujours, ipso facto, un pouvoir d'achat suffisant pour liquider, c'est-à-dire annuler une fois pour toutes, les valeurs de prix correspondantes.
Le système actuel n'est pas auto-liquidable précisément parce qu'il génère des prix à un rythme plus rapide que celui de distribuer le revenu nécessaire à la consommation auquel ces prix pourraient et devraient correspondre.

J'ai déjà expliqué, dans l'article du mois dernier, pourquoi ce déséquilibre structurel entre les prix et les revenus est faux, tant sur le plan éthique que pragmatique. L'objectif du présent article sera d'élucider ce qui est responsable de l'écart très injuste entre les coûts totaux de production et les prix totaux de vente.

Peut-être serait-il préférable de commencer par souligner que le manque de pouvoir d'achat des consommateurs qui est en cause ici n'est PAS causé par des profits (y compris les bénéfices tirés des intérêts sur les prêts) par le réinvestissement de l'épargne dans de nouvelles entreprises productives, ou par les politiques déflationnistes qui sont souvent, en période de ralentissement économique ou de crise financière, adoptées par les institutions financières. Douglas a admis que ces facteurs, et quelques autres, pouvaient exacerber une déficience du pouvoir d'achat de diverses manières, mais ils n'étaient pas la cause primordiale de ce qui est connu dans les investigations sur le Crédit-Social comme «l'écart» entre les coûts de production et les revenus des consommateurs toutes catégories confondues (les consommateurs sont majoritairement aussi des producteurs et ces derniers sont les seuls qui donnent sa valeur à la monnaie).

L'écart récurrent entre le prix de vente et le revenu des consommateurs est dû à un défaut comptable, ou plutôt à une double faille comptable liée à la façon dont le capital réel (les biens de capital) c'est-à-dire les machines et le matériel, est financé et comment ces coûts sont ensuite déterminés par rapport à tout revenu de consommateurs pendant toute la durée de l'amortissement des investissement plus les phases de production, donc les coûts, l'entretien et le remplacement de l'arsenal de production, sont inclus dans l'amortissement du capital réel (les biens de capital).

Il y a deux catégories de coûts qui sont associés au capital réel:

Les frais d'investissement, les prélèvements des sociétés pour récupérer les coûts financiers de l'achat ou de l'installation  d'usines, avec l'achat de machines et d'autres équipements de production et les charges d'exploitation, etc, pour couvrir les frais d'exploitation de ce capital réel qui comporte ses frais d'entretien et d'amortissement ou de remplacement.

Ensemble, ils constituent la composante des coûts en capital qui figure de façon si importante dans la structure des prix de vente de tout bien ou service produit à l'aide de méthodes industrielles et ces coûts sont donc payés directement au quotidien puisqu'ils sont inclus dans les prix de vente.

En vertu des conventions financières existantes, les entreprises (ou toutes autres organisations productives) doivent récupérer la valeur financière du capital réel lui-même afin de rembourser les prêts bancaires habituellement utilisés pour acheter ou fabriquer le capital réel (ou biens de capital).

Pendant toute le parcours et la durée de la fabrication, des financements sont nécessaires pour couvrir tous les coûts de cette fabrication industrielle. C'est ainsi qu'il existe donc deux sortes de financements obligatoires, l'un pour faire face aux coûts purement financiers, l'autre pour faire face aux coûts de la fabrication elle-même (qui inclut le versement des salaires) et des consommations qu'exige toute production de biens et de services.

Nous pouvons nous référer à ce phénomène comme «le double coût du capital réel».

Pour rendre la situation plus concrète, permettez-moi cette illustration de base à titre d'exemple. 
Mon beau-frère, qui est un entraîneur sportif et possède sa propre entreprise de conditionnement physique, a récemment emprunté 100 000 us-dollars à une banque pour acheter des équipements d'exercice physique. Afin de rembourser le prêt (nous ignorerons les paiements d'intérêts), il doit collecter 100 000 USD dans les facturations à ses clients, mais il doit également inclure des frais d'amortissement de 100 000 USD afin que les machines puissent être remplacées le moment venu -> car il doit aussi facturer immédiatement ces coûts à intégrer dans sa comptabilité.
Cela signifie que, en termes de coûts d'investissement seulement, mon beau-frère doit finalement récupérer 200 000 dollars dans ses prix de vente aux consommateurs (sans même parler des frais d'entretien).

Même si nous supposons (ce qui est invariablement contraire aux faits) que le coût initial de fabrication des machines a été entièrement redistribué comme revenus aux travailleurs qui fabriquèrent les machines, seuls 100 000 USD auraient été distribués aux consommateurs en vertu de ces mêmes machines.

En clair, 100 de revenu de consommateur ne peut pas compenser 200 dans des prix. Si, à titre d'exemple, les 100 dans les poches des consommateurs servaient à rembourser le prêt bancaire de 100, la dette et le pouvoir d'achat s'annuleraient mutuellement (chaque prêt bancaire crée un dépôt et le remboursement de chaque prêt bancaire détruit ce dépôt), mais cela laisse derrière lui des équipements dont la valeur de 100 sur le prix devrait être calculée en fonction des prix et sur lesquels aucun pouvoir d'achat n'a été mis à disposition. 
Autrement dit, l'ensemble des revenus des consommateurs qui leur sert à acheter des produits ne "couvrent" qu'une partie du prix de vente.
Clifford Hugh Douglas au début du 20ème siècle et Margrit Kennedy à la fin du même siècle ont bien pointé cet écart irrattrapable entre les revenus et les prix de vente. 
Pour la "petite" histoire, qui devient la plus grosse histoire tragique qui terrasse l'humanité, car c'est une "histoire" silencieuse et non spectaculaire, on peut rappeler que pour pallier à cet écart entre prix de vente et revenu, on a donc recours au - crédit - pour compenser ce manque de pouvoir d'achat lors de l'achat d'un bien; mais à terme, cela aggrave la situation... En effet, dans un premier temps, si cela est à peu près
 viable pour des prêts ordinaires et espacés pour la consommation, cela devient à terme la spirale infernale et fatale et sans fin du naufrage dans les dettes individuelles et collectives trop connues...

Or, si nous acceptons le principe selon lequel le système financier doit refléter exactement ou isomorphiquement les réalités physiques de l'économie, le double calcul du coût du capital réel est manifestement une erreur.

Plus spécifiquement, les charges d'investissement ne correspondent à aucune consommation physique ou réelle. Si elles doivent être traitées comme des catégories distinctes ou additionnelles de coût (c'est le cas dans le système actuel) elles n'ont pas leur place ici et sont complètement illégitimes.

Dans le système actuel, non seulement les frais d'investissement sont mal placés, voire illégitimes, mais si l'on observe bien, aucun pouvoir d'achat du consommateur ne se trouve créé automatiquement ni distribué au cours du processus de production en raison des frais d'investissement avec lesquels ces charges pourraient être compensées et liquidées.

Afin d'obtenir une image plus claire du rôle que jouent les charges d'investissement dans la structure des prix de vente des biens et des services, imaginez une chaîne de production impliquant un certain nombre d'entreprises différentes qui contribuent à divers stades à la fabrication de produits. Toutes les entreprises de cette chaîne inter-entreprises de production qui disposent d'emprunts en capital en circulation intègreront une charge dans le prix de leur production intermédiaire pour respecter leurs échéanciers de remboursement et qui seront répercutées sur les entreprises subséquentes. 

Ces entreprises subséquentes demanderont à leur tour de nouveaux emprunts auprès des banques pour obtenir leurs matières premières, car la plupart des productions quotidiennes reposent sur des lignes de crédit renouvelables ou sur des découverts. Tout montant emprunté qui est utilisé pour payer, directement ou indirectement, les frais d'investissement des entreprises précédentes sera détruit dans les remboursements de prêts. Ainsi, bien que ce flux de crédit aux producteurs qui est affecté aux frais d'investissement contribue à l'accumulation des prix, il ne libère jamais de pouvoir d'achat pour les consommateurs avec lesquels les charges d'investissement peuvent être satisfaites. Pour cette raison, la composante des prix pourrait être assimilée au phénomène astronomique d'un trou noir. Il est théorisé que même la lumière elle-même ne peut échapper à un trou noir une fois qu'elle a franchi l'horizon des événements. De la même manière, l'argent, sous forme de crédit au producteur, entre dans le "trou" d'investissement à divers stades de la production, mais ne sort jamais comme revenu du consommateur ou sous toute autre forme. En plus de cela, chaque étape dans la production aura généralement ses propres frais d'investissement à ajouter aux prix de vente, le trou est comme une boule de neige de la dette toujours croissante qui est transmis de producteur en producteur dans la chaîne de production jusqu'à ce que les produits fini soient mis en vente finale auprès des consommateurs, donc normalement liquidé par l'achat du consommateur.

Le premier défaut comptable peut donc se résumer comme suit: des "impôts" sont perçus correspondant à la -valeur financière- du capital réel qui n'est pas représentée ou égalisée dans le revenu du consommateur et qui n'a aucun rapport avec la consommation physique de ces actifs productifs.

Il y a cependant un second problème. Non seulement le système financier inclut une catégorie illégitime de coût pour lequel aucun pouvoir d'achat n'est distribué, mais il ne fournit pas non plus suffisamment de revenus aux consommateurs pour satisfaire intégralement les coûts légitimes en capital qui peuvent être liés à la consommation de capital réel (biens de capital).

Pour revenir à l'exemple de mon beau-frère, il est vrai que si 200 avaient été distribués aux fabricants d'équipements comme salaires, salaires et dividendes, il y aurait suffisamment de pouvoir d'achat du consommateur libéré au cours de la production pour répondre aux coûts d'amortissement de l'équipement tel qu'il est consommé par l'activité de mon beau-frère. Et il est tout à fait approprié que les consommateurs paient pour l'utilisation du capital réel qui est employé dans la fabrication des biens et services que ces consommateurs achètent.

Toutefois, dans la pratique, chaque fois que le capital réel est fabriqué, la valeur totale du prix de ce capital réel (biens de capital) n'est pas distribuée en tant que revenu aux consommateurs.

Pourquoi? Pour la simple raison que ces entreprises productrices de capital réel (bien de capital) les machines, etc, sont comme les autres, elles ont également leurs propres frais d'investissements et de recouvrements et tous les emprunts qu'ils doivent effectuer pour l'achat de matières premières et de services d'autres entreprises, lesquelles, doivent couvrir en partie les divers coûts en capital de toutes les autres entreprises dans les chaînes de production respectives, etc. En d'autres termes, peut-être seulement 50 dollars pourraient avoir été distribués aux consommateurs à tous les stades de la production des machines en exercice. Encore une fois, comment 50 de revenus peuvent-ils compenser 100 de prix? Ils ne le peuvent pas.

La deuxième faiblesse comptable du capital réel pourrait donc être résumée de la manière suivante: une certaine proportion du crédit à la production qui est dépensé au cours de la production du capital (usines, machines, etc) et qui figure ainsi dans les prix des biens d'équipement et des services est verrouillé dans le système producteur et ne sort jamais du système de consommation pour la production, ou du moins pas au même rythme que celui où il est immobilisé, car les valeurs de prix accumulées au cours du processus de la production de capital réel (usines, machines, etc) dépassent les revenus qui sont simultanément distribués, laissant un écart entre les prix de vente et les revenus.

En résumé, le caractère non liquidable du système financier actuel est principalement dû à la nature des coûts en capital pour la production, car ceux-ci sont calculés selon des conventions standards. Si les revenus des producteurs doivent couvrir
la rémunération du capital investit, et ceci au quotidien par leurs achats, c'est autant de pouvoir d'achat en moins, c'est arithmétique.

Vous ne pouvez pas laisser se créer une insuffisance globale de revenus quand ces revenus paient au quotidien pour des investissements qui n'ont pas encore généré de production. Il devrait également être clair que la situation ne cesse de dégénérer. Puisque la tendance générale du progrès technique et économique est que le capital réel (par exemple la robotisation) remplace la main-d'œuvre par l'automatisation croissante dans le processus de production, les coûts en capital augmentent continuellement par rapport au coût de la main-d'œuvre qui diminue, et ce, en proportion des coûts totaux et donc des prix. En d'autres termes, non seulement le système financier n'est pas auto-liquidable, il est de plus en plus non liquidateur avec tous les inconvénients à la clé du manque chronique et croissant de pouvoir d'achat.

Du point de vue du Crédit Social (ou Démocratie Économique), ce fossé structurel et toujours croissant entre les prix et les revenus est le problème social central.

Tel est le défaut technique essentiel dans l'économie et son financement. Ce défaut qui afflige notre civilisation actuelle, car si l'on n'y remédie pas à temps, cela peut conduire à la fin de cette civilisation. C'est-là un agent corrosif qui sape et absorbe silencieusement et progressivement tout ce qui est encore sain dans la structure et le fonctionnement de la société humaine relevant du système financier. L'écart entre les prix et les revenus menace de dissoudre complètement le «crédit» (ou crédit-social c'est pareil) de la société qui, pourtant, sait de mieux en mieux produire et où les êtres humains agissent -naturellement- en association pour atteindre les résultats positifs escomptés que sape continuellement ce système financier délétère et destructif.

The Social Credit Analysis of Cost
31 août 2016
SITE DU CRÉDIT SOCIAL (en anglais) 
http://www.socred.org/
(traduction automatique par Google revue, corrigée et adaptée en français)


de Gérard Foucher

Une démonstration simple permet d'exposer le fonctionnement et les conséquences de la création monétaire asymétrique, lorsque celle-ci est effectuée sous forme de dette à intérêt par un agent économique privilégié.
Cette démonstration permet de mettre en lumière le fait qu'un groupe d'agents B qui émettent la monnaie par l'endettement d'un autre groupe d'agents NB assure l'asservissement infini du second groupe (les endettés NB) par le premier (les émetteurs B), et ce quel que soit le comportement du groupe B quant à la remise dans le circuit, ou non, des intérêts perçus par lui.

B = banques
NB = non-banques
L'intérêt dû par NB à B est de 5% / an.
En (1), B crée une nouvelle "dette" (de la nouvelle "monnaie") et crédite NB.
En (2), 5% sont remboursés, et dépensés par B en (3), entraînant un effet de boucle.

(1) B : -100 | +100 => NB +100 | -100
(2) B : -100 | +105 => NB +95 | -100
(3) B achète à NB son travail ou ses biens pour une valeur de 5 (i.e. B dépense les intérêts perçus)
(4) B : -100 | +100 => NB +100 | -100
(5) Retour en (2)

Choix 1 : B "dépense" dans l'économie les intérêts qu'il a perçus (étape 3 ci-dessus)
Boucle infinie. NB est asservi perpétuellement à B qui gagne 5% / an sans travail, alors que NB pour les récupérer doit travailler pour B. Le problème ici n'est pas tant l'intérêt "manquant" que NB travaillant éternellement pour B.
B n'a donc aucun intérêt (c'est le mot!) à ce que NB rembourse véritablement cette "dette". Il appellera alors "rembourser" le seul fait de lui payer cette rente éternelle.

Choix 2 : B ne dépense pas les intérêts qu'il a perçus
Si B ne dépense pas les 5 % par an mais les stocke en sautant l'étape 3 (ou n'en dépense qu'une fraction pour stocker l'essentiel), alors il y a véritablement intérêt manquant dans l'économie. NB se voit de plus en plus endetté et au bout de 20 boucles on se retrouve à la situation suivante :
B : -100 | +200 => NB + 000 | -100
À ce moment-là NB ne pourra plus rembourser lors du cycle suivant. Il fait faillite, défaut, ou une négociation a lieu. B est alors muni d'un stock énorme de monnaie, il bénéfice d'un pouvoir d'achat démultiplié sur une économie en déflation (car pendant tout ce temps l'économie aura subi la raréfaction progressive de la monnaie circulante). Il achète alors tout ce qu'il estime comme étant la base économique du prochain cycle au meilleur prix.
Puis le cycle recommence sur la base d'une nouvelle génération d'humains.


Other Social Credit Authors


Capt. W. Adams

     Real Wealth and Financial Poverty

Arthur Brenton

     (Editor of The New Age)

    a. "Social Credit in Summary"
    b. The Veil of Finance
         Veil-of-Finance-by-Arthur-Brenton.pdf

Victor Bridger

     a. A$ + B$ and All That
     b. Social Credit - National Accounting
     c. What is Social Credit?
           SocialCreditDefined.pdf

 W.B. Brockie

     a. New Credits for New Production

 Eric Butler

     (Founder of the Australian League of Rights)
     a. The Enemy Within the Empire
         The-Enemy-Within-the-Empire-Short-History-of-Bank-of-England-Eric-Butler.pdf
     b. The Money Power and Democracy
          Money-Power-and-Democracy-Eric-Butler.pdf
     c. Releasing Reality
     d. Social Credit and Christian Philosophy

L.D.Byrne

     a. Faith, Power, and Action
     b. Mr. Macpherson's Feud
     c. The Nature of Social Credit
          TheNatureOfSocialCredit.pdf

Maurice Colbourne

     b. Unemployment or War

Geoffrey Dobbs

     (Close Douglas associate, Professor of Botany at Bangor, Wales)
     a. Geoffrey Dobbs' introduction to the fifth edition of Economic Democracy
     b. The Just Tax

Duke of Bedford

     a. The Absurdity of the National Debt
     b. Debt-free Prosperity
    c. Poverty and Over-Taxation: The Way Out
    d. The Years of Transition

Hewlett Edwards

     "What We Are About"

M. Gordon-Cumming

     Money in Industry

C.J.H.

     "The Keynesian Revolution"

John Hargrave

     Social Credit Clearly Explained

C. Marshall Hattersley


     The Community's Credit

J.T. Hollow

     Capital and Income

 T.V. Holmes


     The Nature of Credit, Sacred and Profane

E.S. Holter

     The ABC of Social Credit
           TheAbcOfSocialCredit.pdf

Tudor Jones

     (Close Douglas associate, Physicist, and first successor to Douglas as Chairman of the Social Credit Secretariat)
     a. Elements of Social Credit
     b. You and Parliament

A.W. Joseph

     a. The A+B Theorem
     b. Banking and Industry

Dennis Klinck

     a. "The Delusion of Ownership" - Seed
     b. "Pound, Social Credit, and the Critics"

Robert Klinck

     a. "Economist Savaged at Local School"
          HIGHTECHTIMESJAN88.pdf
     b. "Finance and the Environment"
     c. "The Future of Employment"


Wallace Klinck

     a. "On the Proper Role of the Lieutenant Governor and the Governor General"

Georges-Henri Lévesque, O.P.


     Social Credit and Catholicism

C.G.M.  

      a. The Nation's Credit

J.D. Malan

     a. The A+B Theorem
          TheA-BTheorem.pdf      
     b. Money, Fact, and Fiction
           MoneyFactFiction.pdf    
     c. Natural Cost and the Ownership of Money


A. Hamilton McIntyre

     a. Thirteen Years of Progress
          Thirteen-Years-of-Progress.pdf

Bryan W. Monahan

     a. Alternative to Disaster
     b. An Introduction to Social Credit
     c. Neither Do They Spin
     d. A Social Credit Perspective
     e. Why I am a Social Crediter?
          WhyIAmASocialCrediter.pdf

H.M. Murray (H.M.M.)

     a. The A+B Theorem
     b. An Outline of Social Credit
     c. The Struggle for Money

H.E. Nichols


     Alberta's Fight for Freedom

R.L. Northridge 


     "The A+B Theorem"

A.R. Orage

     a. "An Editor's Progress"
     b. "The BBC Speech on Social Credit" and "The Fear of Leisure"
           BBCSpeechOnSocialCredit.pdf

H.R.P.


     "The Cancellation Bogey"

R.S.J. Rands

     The Problem of Money

W.H. Rhys

     Real Wealth and Financial Poverty

Thomas Robertson

     Human Ecology

Aubrey T. Westlake

     Social Credit

Jean Campbell Willett

     Women and Poverty
          Woman-and-Poverty.pdf

A.E. Willyams

     Social Credit is For Me


Texts with Mutliple Authors


     a. Leisure
     b. The Southampton Chamber of Commerce - Report of the Economic Crisis Committee (1933)

Social Credit Journals:

Viewing all 2306 articles
Browse latest View live


Latest Images